
Hurricane FLORENCE


NOAA-20/S-NPP VIIRS I5 Band Images - 6-11 September 2018
Hurricane Florence poses an imminent threat to the coastal Mid-Atlantic region. Using the JPSS Program's new JSTAR Mapper website, screen captures of SNPP and NOAA-20's VIIRS I5 band were composited to show the storm's evolution between September 6, 2018 and September 11, 2018. Florence will be monitored by many experts before and after landfall, therefore it is necessary to have tools such as JSTAR Mapper to aid in observation efforts.
Thanks and credit: STAR LTM team: Lihang Zhou, Ryan Smith, Tom Atkins, Lori Brown. Click images to enlarge.
S-NPP VIIRS SST Images - 7-11 September 2018
S-NPP VIIRS Sea Surface Temperature (SST) animation images generated from JSTAR Mapper between September 7, 2018 and September 11, 2018.
Thanks and credit: STAR LTM team: Lihang Zhou, Ryan Smith, Tom Atkins, Lori Brown. Click images to enlarge.
S-NPP ATMS MiRS TPW Images - 7-10 September 2018
S-NPP ATMS MiRS Total Precipitable Water (TPW) animation images generated from JSTAR Mapper between September 7, 2018 and September 10, 2018.
Thanks and credit: STAR LTM team: Lihang Zhou, Ryan Smith, Tom Atkins, Lori Brown. Click images to enlarge.
FLORENCE Animation, CMORPH Rain Rate since Sep 4, 2018
CMORPH Rain Rate: a blended product, uses multiple JPSS products as inputs.
Thanks and credit: NCEP/CPC, Pingping Xie, project funded by JPSS PGRR. Click images to enlarge.
FLORENCE 3D Animation, 5-14 September, 2018
Florence, a strong Category 4 hurricane, is moving closer to Carolinas and threatens catastrophic flooding on the East Coast. Using the vertical temperature profiles derived from limb corrected and gap-filing ATMS data from channels 1 through 15 and the VIIRS cloud top reflectivity at band I1 (0.64µm) as background, the 3D animation of the Hurricane Florence on September 5-14 captured the temperature differences between the outer and the inner portions of the hurricane, known as the upper-level warm core structure. The formation of such upper-level warm core is believed to be very important for the rapid intensification of tropical cyclones. A series of such animations are produced at NOAA JPSS spanning each day as the hurricane develops to facilitate the hurricane forecast and strategic planning, as well as scientific investigations on hurricane intensification and trajectory prediction.
Thanks and credit: STAR ICVS team. Banghua Yan, and Jingfeng Huang. Click images to enlarge.
FLORENCE: AMSR2 overlaid on ABI longwave IR
Animation image from AMSR2 getting overlaid on ABI longwave IR, showing the internal structure you can see with microwave that you don't get with IR.
Thanks and credit: Patrick Charles Meyers, Xiwu Zhan, Ralph Ferraro, Limin Zhao. Click images to enlarge.
FLORENCE: JPSS Blended Hydro Product, TPW, 10 September, 2018
Stormed-centered Total Precipitable Water (TPW) image from JPSS Blended Hydro Product.
Thanks and credit: JPSS Blended Hydro Product Team: Limin Zhao, Ralph Ferraro, Patrick Charles Meyers. Click images to enlarge.
FLORENCE: JPSS Blended Hydro Product, Rain Rate, 10 September, 2018
Stormed-centered Rain Rate (RR) image from JPSS Blended Hydro Product.
Thanks and credit: JPSS Blended Hydro Product Team: Limin Zhao, Ralph Ferraro, Patrick Charles Meyers. Click images to enlarge.
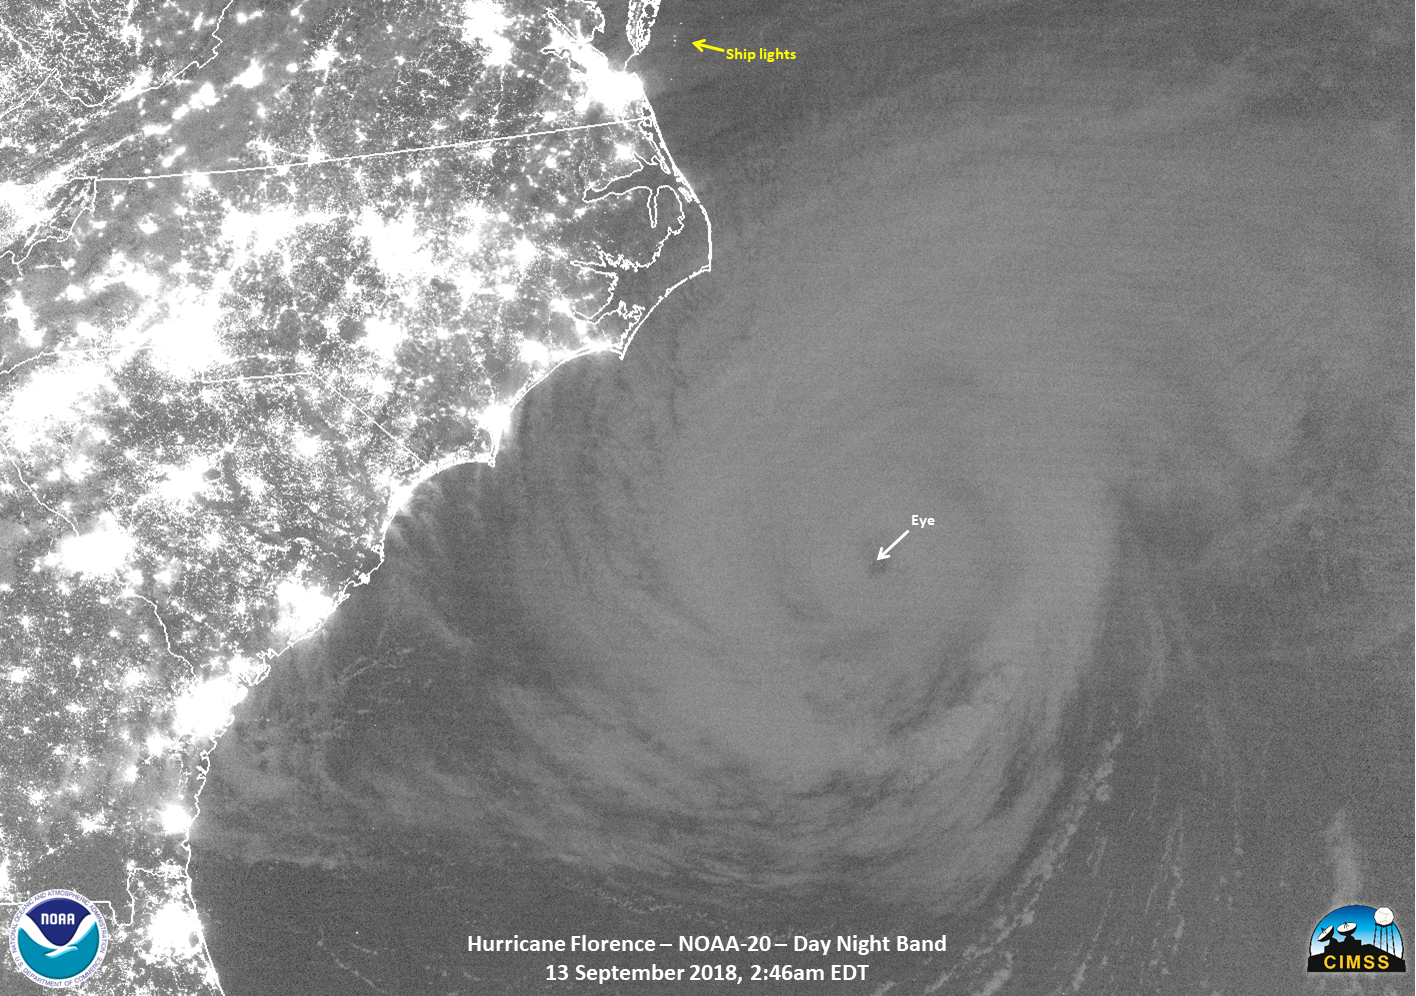
FLORENCE: NOAA-20 Day-Night-Band imagery, 14 September, 2018
Thanks and credit: William Straka (SSEC/CIMSS). Click images to enlarge.
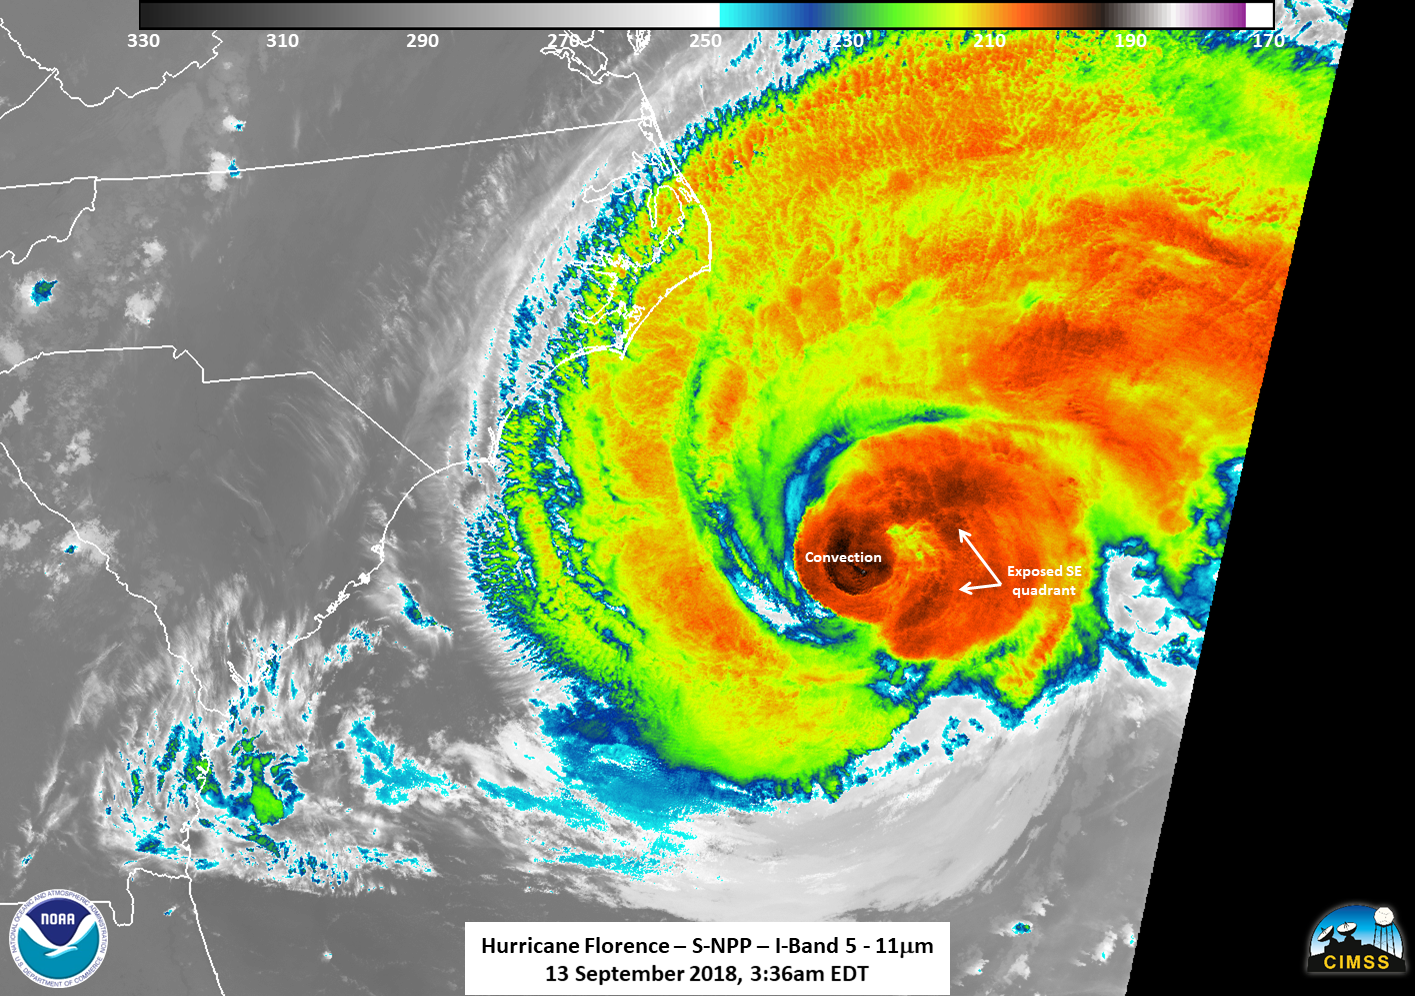
FLORENCE: NOAA-20 I-Band 5 imagery, 14 September, 2018
Thanks and credit: William Straka (SSEC/CIMSS). Click images to enlarge.
FLORENCE: S-NPP Day-Night-Band imagery, 14 September, 2018
Thanks and credit: William Straka (SSEC/CIMSS). Click images to enlarge.
FLORENCE: S-NPP I-Band 5 imagery, 14 September, 2018
Thanks and credit: William Straka (SSEC/CIMSS). Click images to enlarge.
- Hurricane Florence 3D Animation from ATMS/VIIRS data:
Credit: STAR ICVS team. Banghua Yan, and Jingfeng Huang
- 2018/09/05, 2018/09/06, 2018/09/07, 2018/09/08, 2018/09/09, 2018/09/10, 2018/09/11, 2018/09/12, 2018/09/13, 2018/09/14,
- Brightness Temperature: 2018/09/10, 2018/09/12,
- Tracking of Atlantic Tropical Cyclones using Combined S-NPP and NOAA-20 CrIS Observations
- Hurricane Florence observed from Microwave Integrated Retrieval System (MIRS):
Credit: STAR MiRS team. Mark Liu, Christopher Grassotti, Shuyan Liu, Yong-Keun Lee, Ryan Honeyager
- Joint view of NOAA-20/S-NPP/MetOp-B/GPM MiRS Products
- MiRS retrievals from multi-sensors on N-20, SNPP, GPM, and Metop-B: Rain Rate, Total Precipitable Water
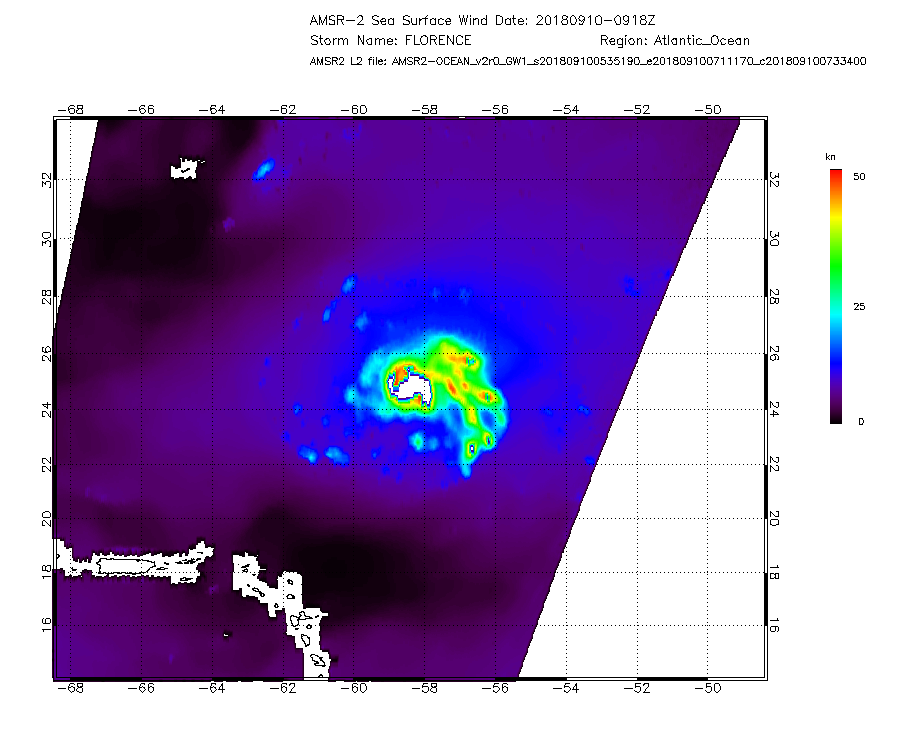
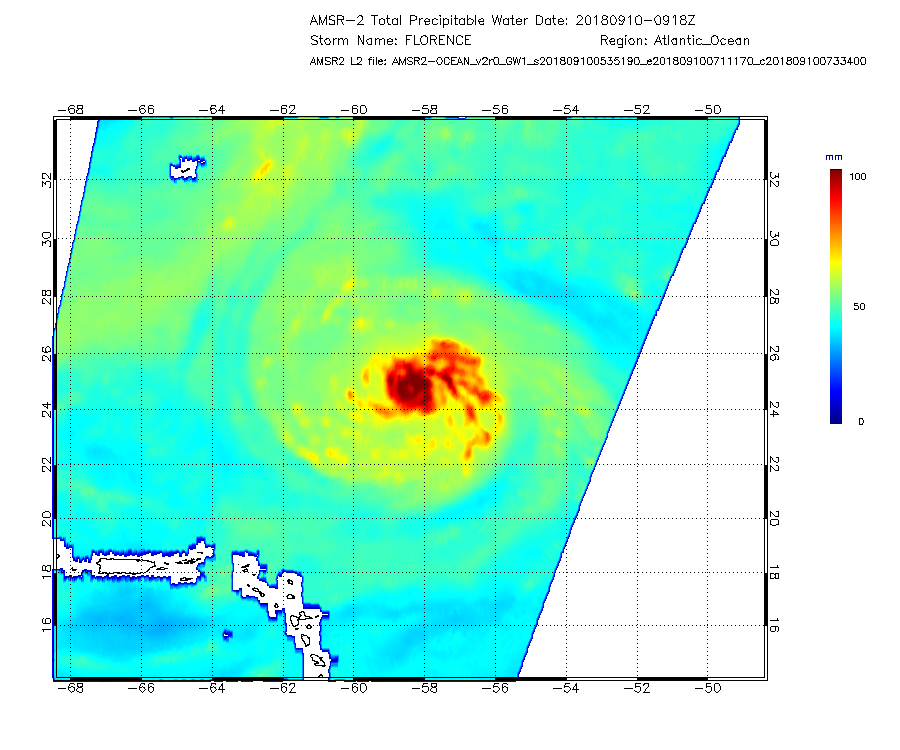
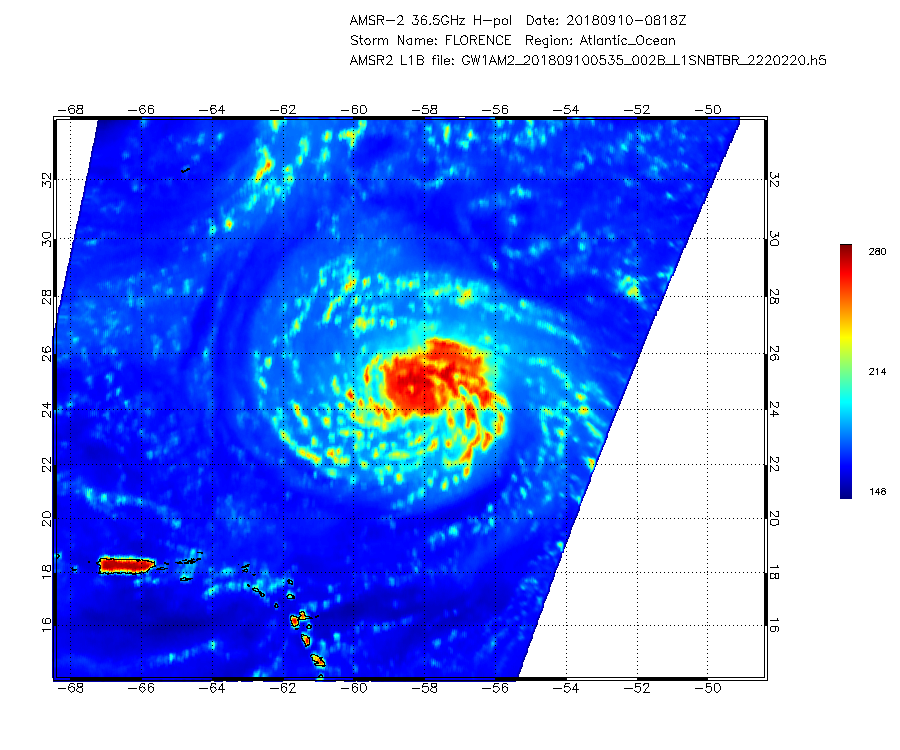
- Stormed-centered images (2018/09/10):
Credit: Limin Zhao, Ralph Ferraro, Patrick Charles Meyers, Paul Chang
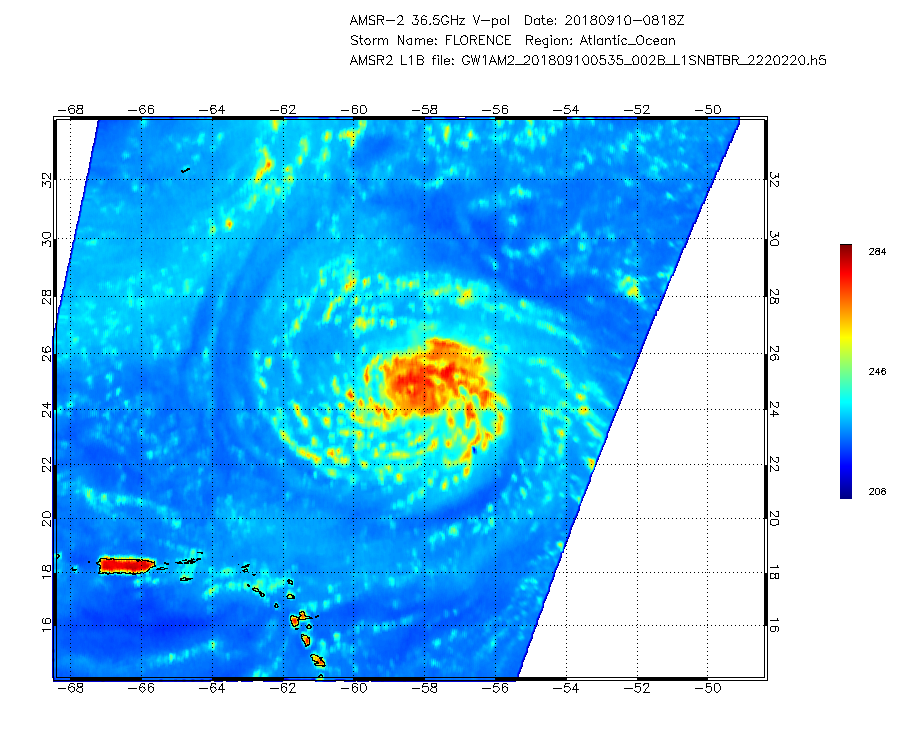
- From GCOM: Sea Surface Winds (SSW), TPW, L1B (36.5GHz H-Pol), L1B (36.5GHz V-Pol)
- From Blended Hydro: Rain Rate (RR), Total Precipitable Water (TPW)
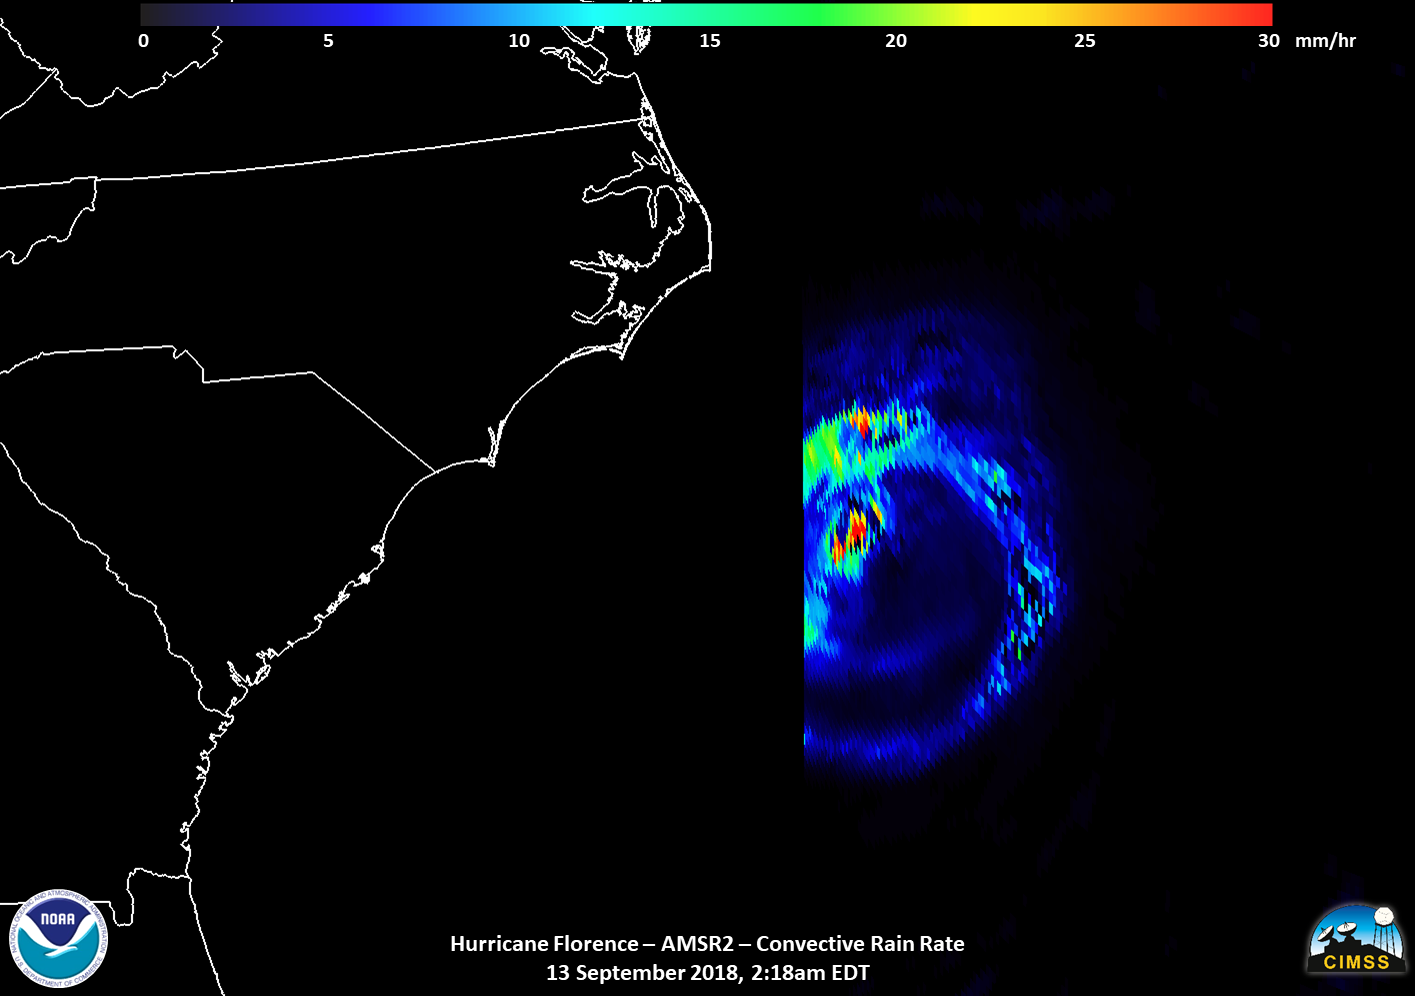
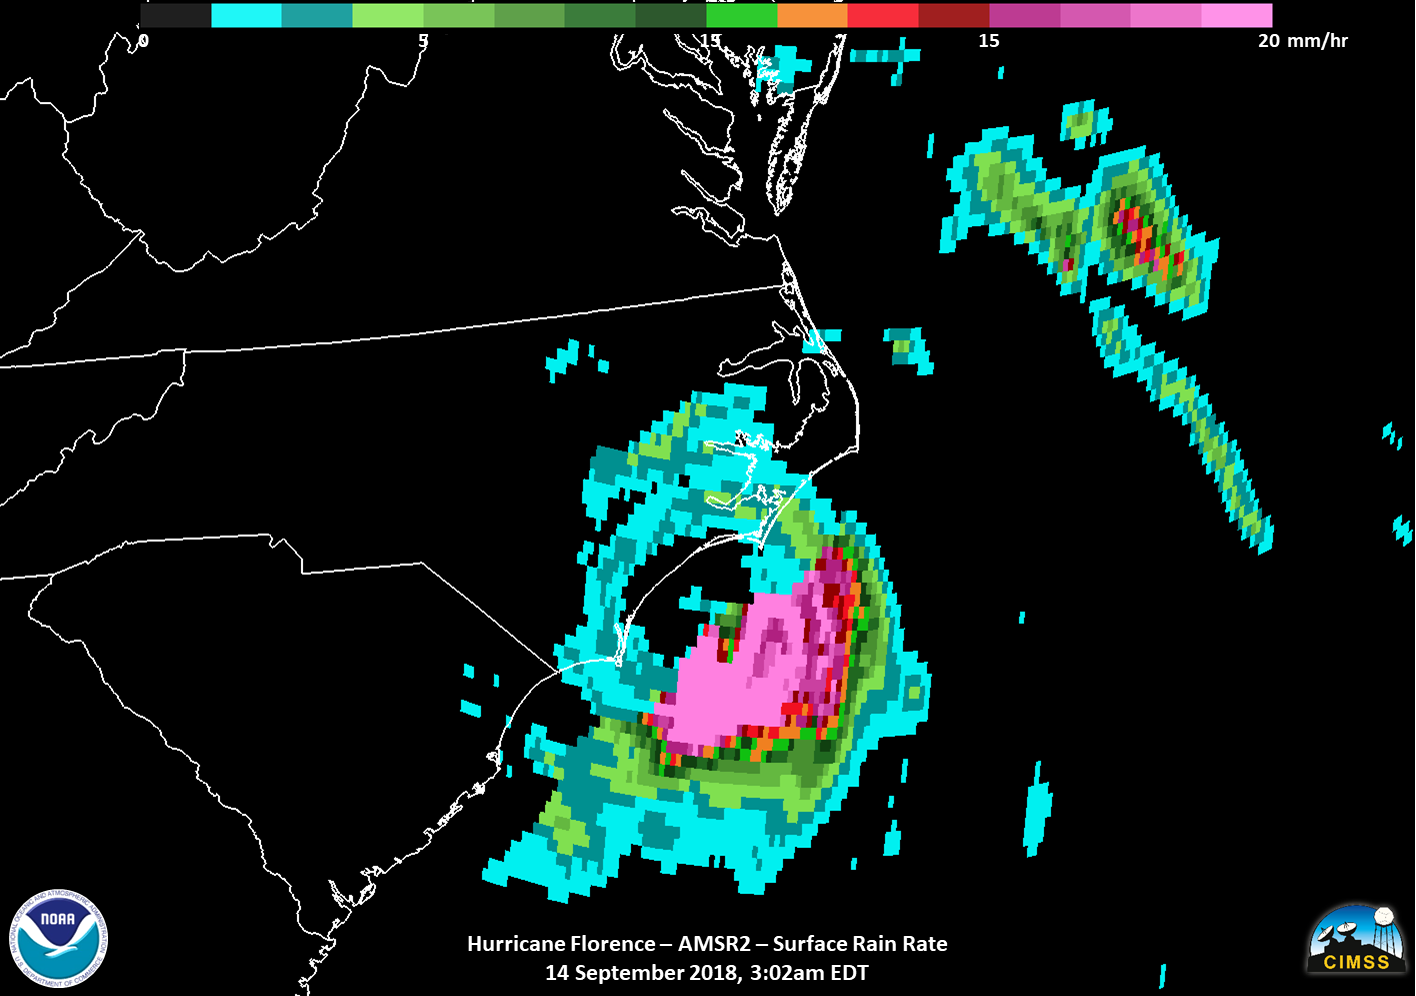
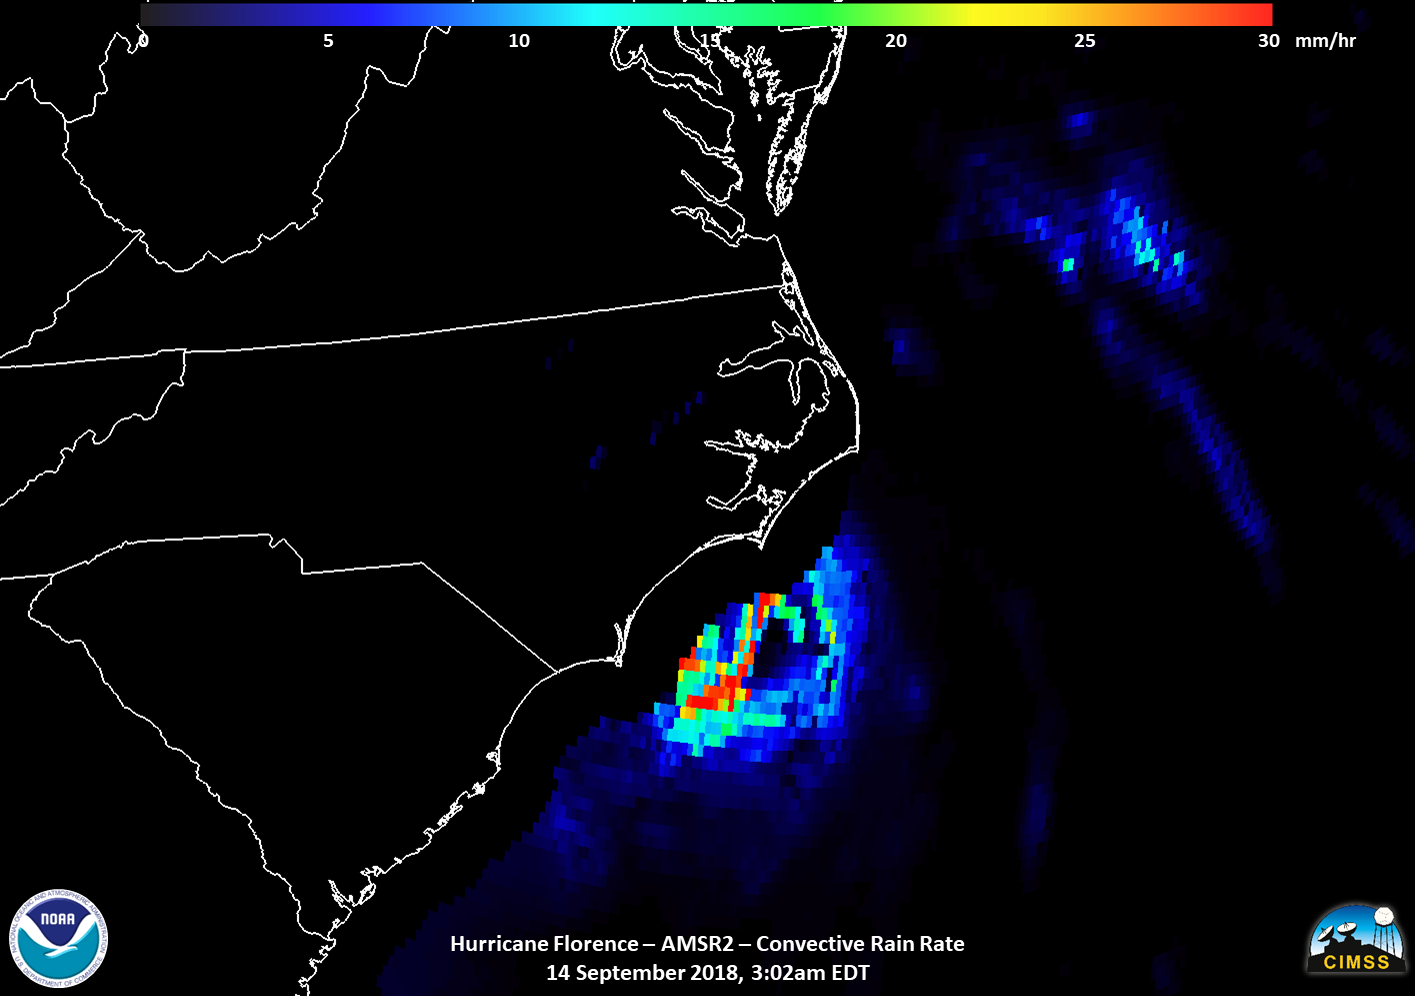
- Hurricane Florence images from VIIRS & AMSR2:
Credit: William Straka (SSEC/CIMSS)
- From VIIRS:
2018/09/13: NOAA-20 I-Band 5, NOAA-20 Day-Night-Band, S-NPP I-Band 5
2018/09/14: NOAA-20 I-Band 5, NOAA-20 Day-Night-Band, S-NPP I-Band 5 S-NPP Day-Night-Band, - From AMSR2:
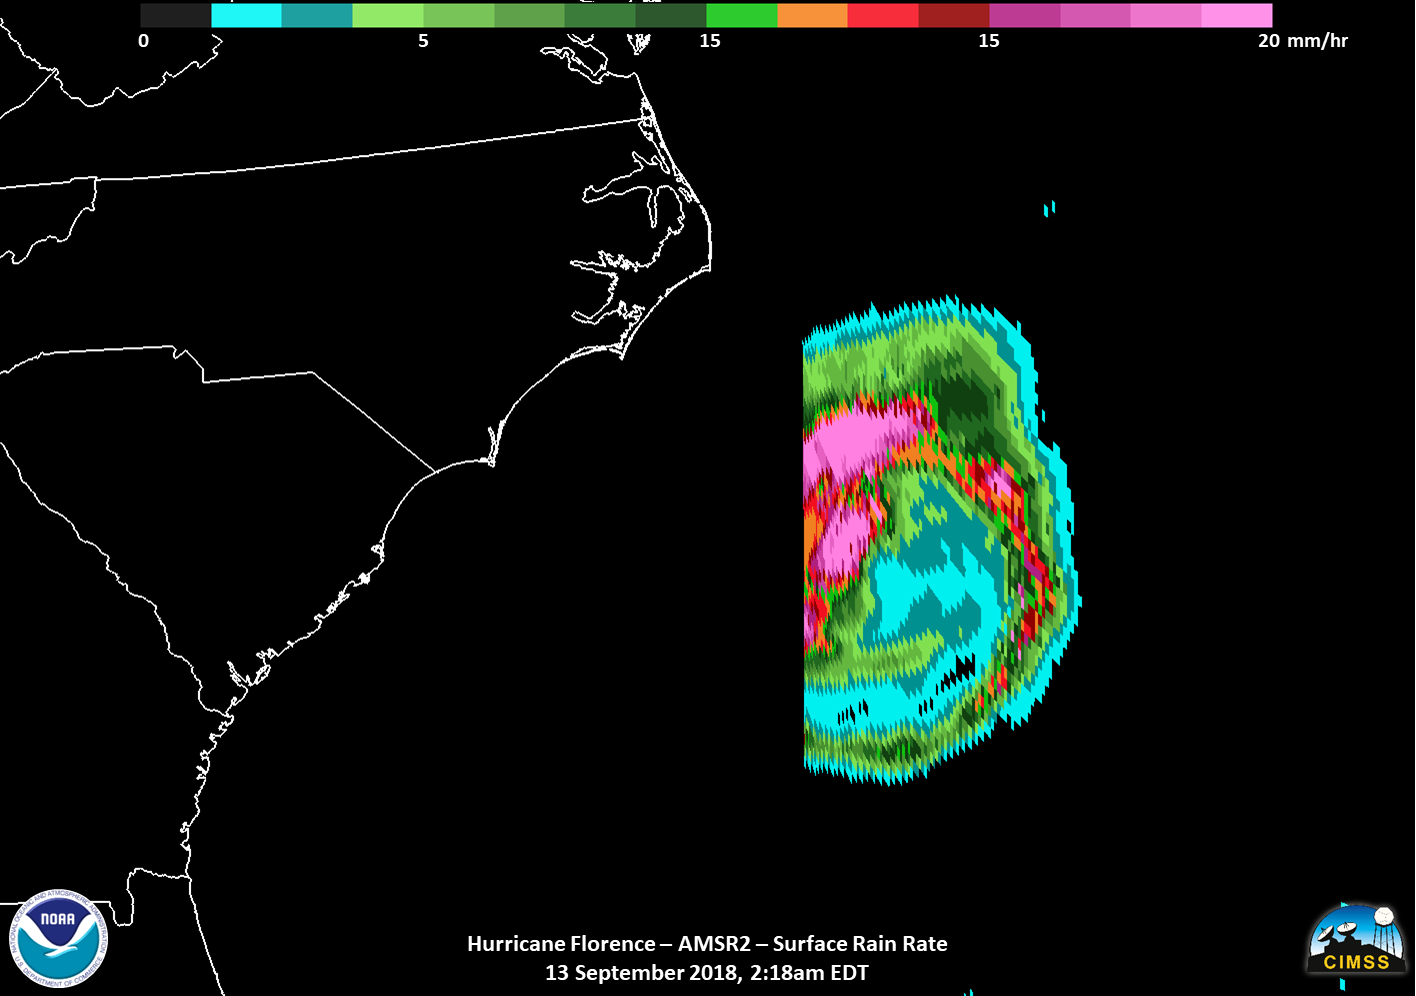
2018/09/13: Surface Rain Rate, Convective Rain Rate 89.0 GHz AV BT,
2018/09/14: Surface Rain Rate, Convective Rain Rate
- From VIIRS:
- Real-Time Monitoring of Hurricane Florence with CMORPH Credit: Pingping Xie, CPC,project funded by JPSS PGRR
- JPSS Blended Hydro Products over Atlantic: Credit: JPSS Blended Hydro Product Team: Limin Zhao, Ralph Ferraro, Patrick Charles Meyers
- NHC Hurricane Florence