STAR JPSS 2015 News Gallery
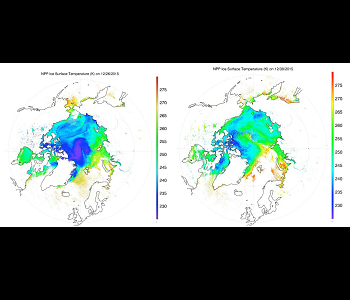
Enterprise VIIRS IST Product Captured Arctic Heat Wave
Jeff Key
30 December 2015 - "On December 302015 the central Arctic Ocean almost reached the melting point an extreme warming event caused by the influx of warm air from the south due to ""Storm Frank"". The area near the North Pole was a similar temperature to Vienna and Chicago and warmer than some parts of the U.S. Midwest. The temperature change from just a few days before was as high as 35 K in some areas."
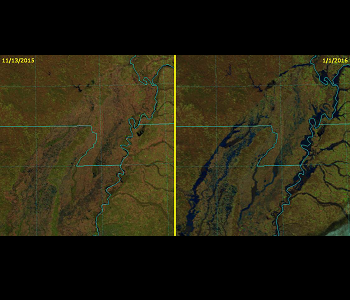
VIIRS Imagery Captured Late Year Mississippi Flooding
Don Hillger
26-28 December 2015 - "The VIIRS Imagery and Visualization Team Blog has been updated with a new post titled ""The Great Flood of 2015"". This post discusses the flood event that impacted the Midwest during the holiday season causing the Mississippi River to reach its highest crest since the Great Flood of 1993. St. Louis MO received 3 month's worth of precipitation in a three day period from December 26-28 2015. Natural-color red-green-blue (RGB) imagery from VIIRS revealed flooding along rivers in Illinois Indiana Missouri Arkansas Kentucky and Tennessee."
The Second Ocean Color Cruise
Menghua Wang
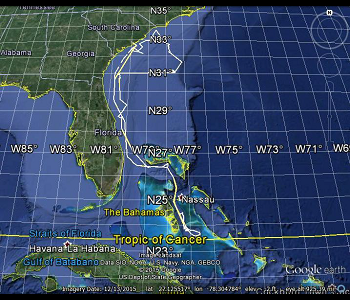
2-14 December 2015 - "The STAR Ocean Color (OC) calibration/validation (cal/val) team conducted the second VIIRS validation cruise aboard the National Oceanic and Atmospheric Administration (NOAA) Ship Nancy Foster. This cruise took place December 2-14 2015 out of Charleston SC and covered the western Atlantic Region from Charleston SC to the Tongue of the Ocean in the Bahamas. Multiple validation measurements were conducted at 27 stations and continuously with flow-through systems over a twelve day period."
Image of the Month - Ozone Hole
Larry Flynn (Graphic from NOAA Visualization Lab)
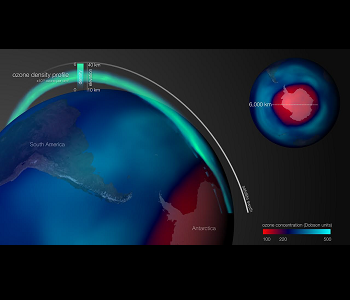
2 October 2015 - The maps show total column ozone for October 2, 2015 from the TOAST product with the color bar ranging for 100 Dobson Units in red to 500 Dobson Units in light blue. Values below 220 DU (red shading) are considered perturbed values representative of ozone hole loss condition. The curtain plot shows one orbit of ozone profile estimates from the OMPS LP. The curtain represents the vertical profile from 10 to 40 km in altitude. The brightness of the cyan colors shows the ozone density ranging for 0-6 x 10¹² ozone molecules/cm3. The dramatic reduction in ozone in the 10 to 20 km range for profiles within the Ozone Hole is consistent with the chemistry of ozone destruction.
Suomi NPP VIIRS FRP Product in IDEA
Shobha Kondragunta; Ivan Csiszar; Hai Zhang
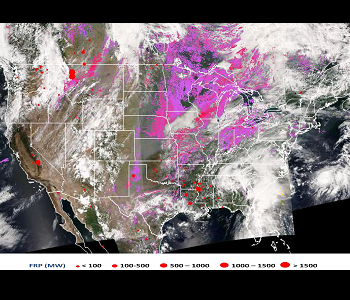
30 August 2015 - Suomi NPP VIIRS smoke aerosol index (light pink to magenta color) shows the smoke plume transport from fires in the western United States for August 30, 2015. Fire hot spots are shown as red dots with dot size indicating the magnitude of the FRP.
Near real time information of FRP, which characterizes the intensity of the fire, and smoke plume areal extent as provided by the IDEA system, are useful for allocating resources by the National Weather Service (NWS) in fighting fires and providing warnings for poor air quality.
Hurricane Sandra
Marco Vargas
25 November 2015 - Suomi NPP passed over Hurricane Sandra on November 25, 2015. On November 26, Hurricane Sandra became the latest Category 4 hurricane of record in either the eastern Pacific or Atlantic basins. VIIRS captured these images between 20:13 - 20:21 UTC
The images were created from five VIIRS granules
a) VIIRS Band I1
b) VIIRS Band I5
c) VIIRS Band I1
d) VIIRS Band I5.
Suomi NPP VIIRS saw Cyclone Chapala
Marco Vargas
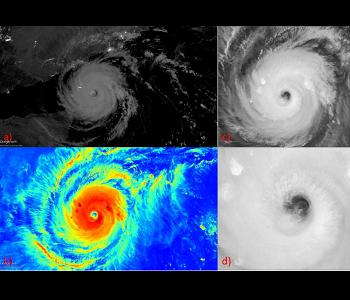
1 November 2015 - Suomi NPP passed over Cyclone Chapala heading towards Yemen on November 1, 2015. VIIRS captured these images between 21:46 - 21:52 UTC
The images were created from five VIIRS granules with the VIIRS Data Display Tool [VDDT].
a) VIIRS Day Night Band (DNB) image
b) VIIRS I5 image
c) and d) close-up images of the storm's eye from the VIIRS Band I5.
VIIRS Image of the Month
Don Hillger; Curtis Seaman
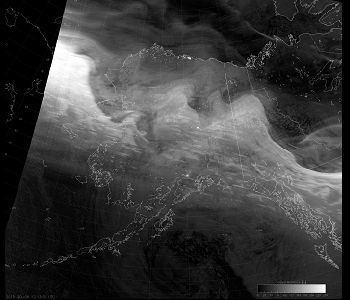
November 2015 - The VIIRS Day/Night Band captured an extensive display of the aurora borealis over Alaska (12:15 UTC 8 October 2015). It is estimated that auroral light emissions were present over more than 90% of the land area of Alaska as it stretched from the Gulf of Alaska to the Arctic Ocean.
Hurricane Patricia Band I5
Marco Vargas
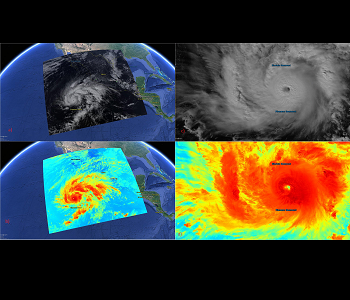
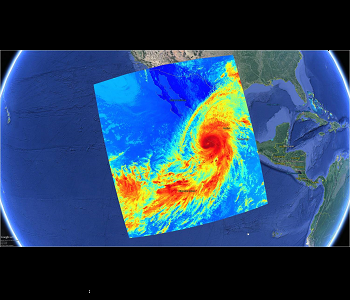
24 October 2015 - Suomi NPP passed over Hurricane Patricia making landfall in Mexico (category 5 with winds of 190mph) on October 24, 2015. VIIRS captured these images between 20:32 - 20:39 UTC
The image was created from six VIIRS granules.
Hurricane Patricia Band I5
Marco Vargas
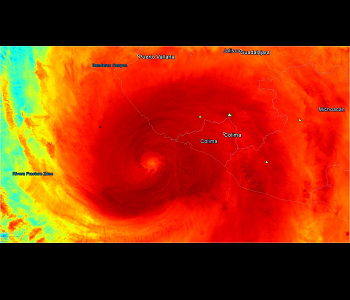
24 October 2015 - Suomi NPP passed over Hurricane Patricia making landfall in Mexico (category 5 with winds of 190mph) on October 24, 2015. VIIRS captured these images between 20:32 - 20:39 UTC
The image was created from six VIIRS granules.
VIIRS Image of the Month
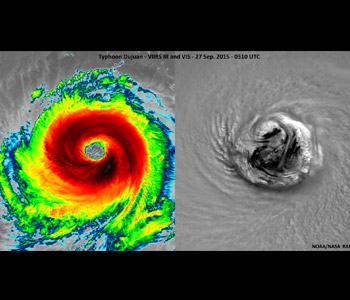
1 October 2015 - Suomi NPP passed over Typhoon Dujuan near its peak intensity of 125 kt on 27 September 2015 and VIIRS captured these striking images at 0510 UTC. The image on the left is the I-band 5 infrared image, and the image on the right shows a close-up of the storm's large eye from the I-band 1 visible. Taiwan can be seen on the west side of the IR image; the storm proceeded to move to the west and make landfall there the following day as a powerful typhoon.
VIIRS spots a haboob
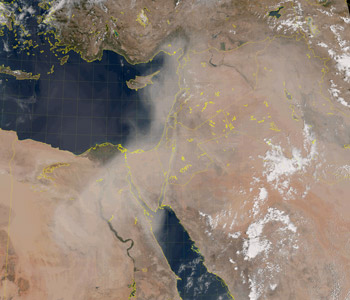
9 September 2015 - The VIIRS Imagery and Visualization Team has a new blog post titled, “Horrendous Haboob in the Heart and Heat of History’s Homeland.” This post discusses the recent week-long sandstorm that impacted seven countries in the Middle East. The sandstorm began on 6 September 2015 over Syria then spread to the southwest, eventually covering most of Egypt by 12 September 2015. The post also discusses dust detection algorithms, including the EUMETSAT Dust RGB and CIRA’s DEBRA imagery product. The blog post can be found here.'
VIIRS Image of the Month
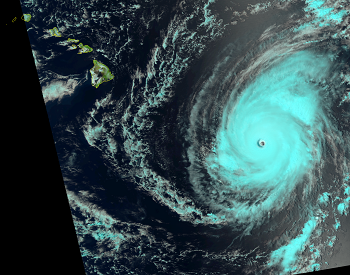
1 September 2015 - This image is a False color (Natural Color) image of Hurricane Ignacio as a Category 4 hurricane approaching Hawaii seen by VIIRS with 375 m resolution on 29 August 2015 at 22:48 UTC. Around the time of this image, there were two other Category 4 hurricanes east of the International Dateline (Kilo and Jimena) - the first time in history that this had occurred.
STAR JPSS Annual Science Team Meeting
28 August 2015 - From August 24-28, STAR JPSS held its annual meeting at NCWCP in College Park, MD. The meeting was well attended, with over 300 virtual and in person attendees including academic and industry partners, as well as users from NOAA and around the world.
The meeting began with overview talks given by the organization and program leadership. In addition to the many detailed talks on the status of the SDR and EDR products, and their progress towards preparing for JPSS-1 (J1), the meeting also featured sessions detailing user engagement with JPSS products, cutting edge applications being produced with JPSS data, and the details of data access and reprocesses schemes. Additionally, because so many team members were able to attend in person, various teams were able to hold rare face to face side meetings.

