
STAR / SMCD / SPB Solar Backscatter Ultraviolet (SBUV/2) Project - Data Products
Version 8 SBUV & SBUV/2 Sample Images
Click on a thumbnail to view an enlarged image below
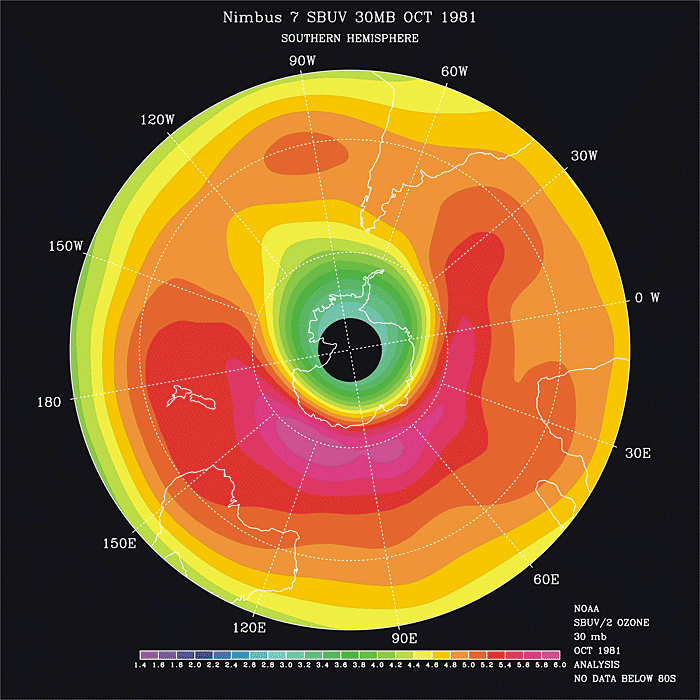
Figure 1
This is a false color contour map of the atmospheric ozone mixing ratio at 30 mbar. The map shows the mean ozone for the month of October 1981 over the southern hemisphere as measured by the Nimbus-7 SBUV instrument. The ozone amounts vary from a quasi-circular region with lower ozone mass mixing ratio concentrations from 2.8 to 3.8 (ppmv) over the Antarctic continent to a collar region from 40 to 70 S latitude from the South Atlantic eastward beyond New Zealand with higher concentrations up to 6.0 (ppmv). The values drop off toward lows of 4.0 (ppmv) as one moves toward the Equator.
 over the Antarctic continent to a collar region from 40 to 70 S latitude from the South Atlantic eastward beyond New Zealand with higher concentrations up to 6.0 (ppmv). The values drop off toward lows of 4.0 (ppmv) as one moves toward the Equator.")
Figure 1
 over the southern hemisphere as measured by the NOAA-16 SBUV/2 instrument. The ozone amounts vary from a quasi-circular region with lower ozone concentration mass mixing ratios from 1.4 to 3.5 (ppmv) over the Antarctic continent to a collar region from 50 to 70 S from the Southern Indian Ocean eastward beyond New Zealand with higher concentrations up to 6.0 (ppmv). The values drop off toward lows of 4.0 (ppmv) as one moves toward the Equator, similar to the 1981 results.")
Figure 2

Figure 3
 over the southern hemisphere as measured by the NOAA-16 SBUV/2 instrument. The ozone amounts vary from a quasi-circular region over the Antarctic continent with lows down to 115 Dobson Units to a collar region from 60 to 70 S south of Australia with values as high as 410 Dobson Units. The low ozone amounts now form the Ozone hole (as defined by values below 220 Dobson Units) over much of the Antarctic Circle. The high collar is still present, but the area and maximum values are both reduced. The values drop off toward lows of 250 Dobson Units as one moves toward the Equator, similar to the 1981 results.")
Figure 4
, and a large \"mouth\" of high ozone south of Australia with values as high as 6.2 (ppmv). The ozone eyes are formed by the ozone values within the two lobes of the split ozone hole.")
Figure 5
 south of Africa and a high ozone region south of Australia with concentrations as high as 6.4 (ppmv). The low ozone region corresponds to one lobe of the split polar vortex. The lobe over the southeastern Pacific appears as a slightly depressed region with values remaining above 4.4 (ppmv).")
Figure 6
 over much of the Southern Hemisphere.")
Figure 7
, but with a region over Antarctica and the southern Indian Ocean with concentrations as low as 2.3 (ppmv). The 1 mbar ozone values are just beginning to show the effects of interactions with particles from a major solar event.")
Figure 8
. The 1 mbar ozone values show the full effects of interactions between atmospheric ozone and particles from a major solar event. Outside of this region, concentrations are in the normal 2.7 to 3.2 (ppmv) range.")