STAR / SMCD / SPB Solar Backscatter Ultraviolet (SBUV/2) Project - Data Products - Version 8 Algorithm Description
Version 8 Algorithm Description
The Solar Backscatter Ultraviolet instruments, SBUV on Nimbus 7 and SBUV/2s on NOAA-9, -11, -14, -16 and -17, are nadir-viewing instruments that infer total column ozone and the ozone vertical profile by measuring sunlight scattered from the atmosphere in the ultraviolet spectrum. Heath et al. (1975) describes the SBUV flown on Nimbus-7. Frederick et al. (1986), and Hilsenrath et al. (1995) describe the follow-on SBUV/2 instruments flown on the NOAA series of spacecraft.
The instruments are all of similar design: nadir-viewing double-grating monochromators of the Ebert-Fastie type. The instruments step through 12 wavelengths in sequence over 24 seconds, while viewing the Earth in the fixed nadir direction with an instantaneous field of view (IFOV) on the ground of approximately 180 km by 180 km. To account for the change in the scene-reflectivity due to the motion of the satellite during the course of a scan, a separate co-aligned filter photometer (centered at 343 nm on SBUV; 380 nm on SBUV/2) makes 12 measurements concurrent with the 12 monochromator measurements. Each sequence of measurements is separated by 8 seconds from the next, producing a complete set every 32 seconds on the daylight portions of an orbit.
The instruments are flown in polar orbits to obtain global coverage. Since the SBUV ozone measurements rely on backscattered solar radiation, data are only taken on the dayside of each orbit. There are about 14 orbits per day with 26 degrees of separation at the equator. Unfortunately, the early NOAA polar orbiting satellites are not sun-synchronous. For example the NOAA-11 equator crossing times drifted from 1:30 pm (measurements at 30 degrees solar zenith angle at the equator) at the beginning of 1989 to 5:00 pm by the end of 1995 (measurements at 70 degrees solar zenith angle). As the orbit drifts, the terminator crossing location moves to lower latitudes and coverage decreases.
Ozone profiles and total column amounts are derived from the ratio of the observed backscattered spectral radiance to the incoming solar spectral irradiance. This ratio is referred to as the backscattered albedo. The only difference in the optical components between the radiance and irradiance observations is the instrument diffuser used to make the solar irradiance measurement; the remaining optical components are identical. Therefore, a change in the diffuser reflectivity will result in an apparent trend in ozone. This is the key calibration component for the SBUV(/2) series. See Hilsenrath et al. (1995) for a longer discussion.
The spectral resolutions for SBUV(/2) monochromators are all approximately 1.1 nm, full-width at half-maximum (FWHM) with triangular bandpasses. The bandwidths of the photometers are approximately 3 nm FWHM. The wavelength channels used for Nimbus 7 SBUV were: 256, 273, 283, 288, 292, 298, 302, 306, 312, 318, 331, and 340 nm. The wavelengths for NOAA-9 and the other NOAA SBUV/2 instruments were very similar except that the shortest channel was moved from 256 nm to 252 nm in order to avoid emission in the nitric oxide gamma band that contaminated the SBUV Channel 1 measurement. Data from the 256 and 252 nm channels are not used in this Version 8 processing for any of the instruments.
Version 8 SBUV(/2) Ozone Profile Retrieval Algorithm (V8A)
The Version 8 SBUV(/2) ozone profile retrieval algorithm combines backscattered ultraviolet measurements and a priori profile information in a maximum likelihood retrieval. See Rodgers (1990) for an analysis of this class of retrievals. It improves on the Version 6 SBUV(/2) algorithm described in Bhartia et al. (1996). Among the improvements are the following:
- The V8A has a new set of a priori profiles varying by month and latitude, leading to better estimates in the troposphere (where SBUV/2 lacks retrieval information) and allowing simplified comparisons of SBUV/2 results to other measurement systems (in particular, to Umkehr ground-based ozone profile retrievals which use the same a priori data set).
- The V8A has a true separation of the a priori and first guess. This simplifies averaging kernel analysis. Examples and further information are provided below.
- The V8A has improved multiple scattering and cloud and reflectivity modeling. These corrections are updated as the algorithm iterates toward a solution.
- Some errors present in the V6A will be reduced. These include the elimination of errors on the order of 0.5% by improved fidelity in the bandpass modeling.
- The V8A incorporates several ad hoc Version 6 algorithm improvements directly. These include better modeling of the effects of the gravity gradient, better representation of atmospheric temperature influences on ozone absorption, and better corrections for wavelength grating position errors.
- The algorithm uses improved terrain height information and gives profiles relative to a climatological surface pressure.
- The V8A is also designed to allow the use of more accurate external and climatological data and allow simpler adjustments for changes in wavelength selection.
- Finally, the V8A is designed for expansion to perform retrievals for hyperspectral instruments, such as the Ozone Monitoring Instrument (OMI), the Global Ozone Monitoring Experiment (GOME-2) and the Nadir Profiler in the Ozone Mapping and Profiler Suite (OMPS).
The atmospheric ozone absorption decreases by several orders of magnitude over the 252 to 340 nm wavelength range. The V8A uses a variable number of backscattered ultraviolet measurements depending on the solar zenith angle (SZA) of the observations to maintain its sensitivity to ozone changes in the lower atmosphere. For small SZAs (the sun high in the sky), only six wavelengths are used in the retrievals. They are at 273 nm, 283 nm, 288 nm, 292 nm, 298 nm, and 302 nm. As the SZA increases the 306 nm, then the 313 nm and finally the 318 nm channels are added to the retrieval.
Version 8 Algorithm A Priori Profiles
The a priori profile database is provided in a data file: climat.txt, (TXT, 20 KB). The profile data set gives the climatological averages for 18 10-degree latitude bands and 12 months. These profiles can be used to determine the information used in a specific retrieval by interpolating in latitude and day with a FORTRAN code, (TXT, 18 KB). The lowest layer from the a priori program will differ from that used in the retrieval if the surface pressure is not 1 atmosphere. Another data file: terrain.txt, (TXT, 1.31 MB) and FORTRAN code, (TXT, 2 KB) are provided to generate the surface pressure for a given latitude and longitude.
The a priori covariance is constructed as follows: the diagonal elements correspond to 50% variance and the non-diagonal covariance elements fall off with a correlation length of twelve fine layers (approximately two Umkehr layers). The measurement covariance is diagonal and corresponds to radiance errors of 1% in each channel.
The profile database was created from 15 years (1988 to 2002) of ozonesonde measurements and SAGE (Version 6.1) and/or UARS-MLS (Version 5) data. Over 23,400 sondes from 1988 to 2002 were used in producing this climatology. Data was "filtered", i.e., obvious bad data points were removed. Data from balloons that burst below 250 hPa were discarded. Data from bouncing balloons were sorted by pressure. Note: No total ozone correction factors (TOMS or Dobson) filtering were used. The stations were weighted equally for each band so that we do not introduce any additional longitudinal biases (e.g., Resolute and Nyalesund have equal weights in December even though Nyalesund has three times as many sondes as Resolute for that month). The SAGE data was also "screened" to remove anomalous retrievals Average profiles from ozonesondes and SAGE are merged over a 4-km range with the sonde weight decreasing from 80 to 60 to 40 to 20% and the SAGE weight increasing correspondingly.
Averaging Kernel Plots for Nimbus 7
This section gives some sample averaging kernel plots to help describe the V8A retrieval capabilities. The averaging kernels give the theoretical responses in the retrieval layer amounts to changes in the true atmospheric profiles.
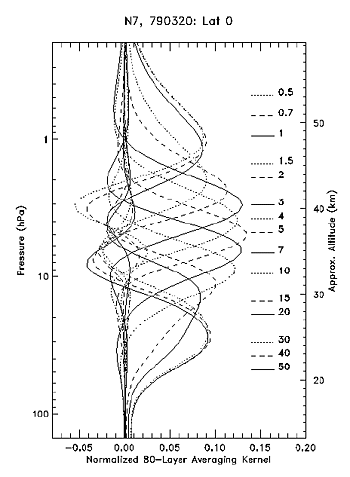
 Figure 1 shows Averaging Kernels (AKs) (for fractional changes in ozone) at
the 15 pressure levels where the ozone mixing ratios are provided on this
DVD. The short horizontal lines on the right side of the graph show the
pressure levels and point to the corresponding AK. The horizontal and AK
lines’ styles correspond. In general, the (fractional) variation in the
mixing ratio reported by SBUV at a given pressure level is a weighted
average of the (fractional) variation of the mixing ratio at surrounding
altitudes, relative to the a priori profile. Since the SBUV V8 a priori
profiles have no inter-annual variation, the AKs also show how the
algorithm would smooth a long-term trend in ozone mixing ratio. Note,
however, that individual SBUV profiles usually have structures that are
finer than those implied by the AKs; these structures come from the
assumed a priori profile, rather than from the measurements themselves.
This figure shows typical AKs at the equator. The AKs show best resolution
of ~6 km near 3 hPa, degrading to ~10 km at 1 and 20 hPa. Outside this
range the retrieved profiles have little information. For example, the
(fractional) variation in ozone mixing ratio seen at 0.5 hPa actually
represents the (fractional) variation from the region around 1 hPa, and
the variation around 50 hPa represents the variation from around 30 hPa.
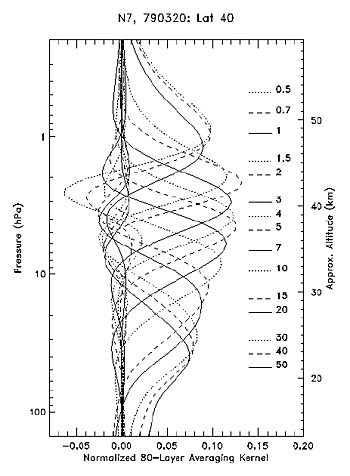
 Figure 2 shows typical AKs for March at 40N latitude. At this latitude the
50 hPa AK does capture some of the atmospheric variation, albeit with a
resolution of ~11 km. In general, the upper AKs get progressively better
as the solar zenith angle increases, and the lower AKs become better as
the ozone density peak drops in altitude.
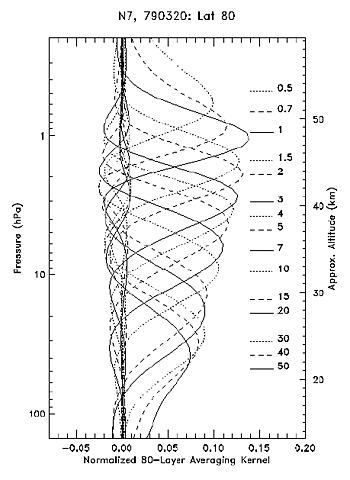
 Figure 3 shows typical AKs for March at 80N latitude. One can see the
improvement in AKs for the upper portions of the profile, especially the
0.5, 0.7, 1, and 1.5 hPa AKs, in capturing the atmospheric variation more
accurately than in Figures 2 and 1, with better resolution of ~6 km at 0.7
hPa.
References
Bhartia, P.K., S. Taylor, R.D. McPeters, and C. Wellemeyer, Application of the Langley plot method to the calibration of the solar backscatter ultraviolet instrument on the Nimbus 7 satellite, J. Geophys. Res., 100, 2997-3004, 1995.
Bhartia, P.K., R.D. McPeters, C.L. Mateer, L.E. Flynn, and C.G. Wellemeyer, Algorithm for the estimation of vertical profiles from the backscattered ultraviolet technique, J. Geophys. Res., 101, 18, 793-18, 806, 1996.
Frederick, J.E, R. P. Cebula, and D. F. Heath, Instrument characterization for the detection of long-term changes in stratospheric ozone: An analysis of the SBUV/2 radiometer, J. Atmos. Oceanic Technol., 3, 472-480, 1986.
Gleason, J.F, R.D. McPeters, Correction to the Nimbus 7 solar backscatter ultraviolet data in the "nonsync" period (February 1987 to June 1990), J. Geophys. Res., 100, 16, 873-16, 877, 1995.
Heath, D. F., A. J. Krueger, H. R. Roeder, B. D. Henderson, The solar backscatter ultraviolet and total ozone mapping spectrometer (SBUV/TOMS) for Nimbus G, Optical Engineering, 14, 323-331, 1975.
Heath, D.F., Z. Wei, W.K. Fowler, and V.W. Nelson, Comparison of Spectral Radiance Calibrations of SSBUV-2 Satellite Ozone Monitoring Instruments using Integrating Sphere and Flat-Plate Diffuser Technique, Metrologia, 30, 259-264, 1993.
Hilsenrath, E., R.P. Cebula, M.T. Deland, K. Laamann, S. Taylor, C. Wellemeyer, and P.K. Bhartia, Calibration of the NOAA-11 Solar Backscatter Ultraviolet (SBUV/2) Ozone Data Set from 1989 to 1993 using In-Flight Calibration Data and SSBUV, J. Geophys. Res., 100, 1351-1366, 1995.
Rodgers, C. D., The Characterization and Error Analysis of Profiles Retrieved from Remote Sounding Measurements, J. Geophys. Res., 95, 5587- 5595, 1990.
