 Equator Ratio (Retrieved / A Priori) Time Series
The APPENDIX contains similar plots for other latitudes and contour plots of the offsets in the results for pairs of instruments during their overlap periods. The contour plots show the differences as a function of altitude and latitude.
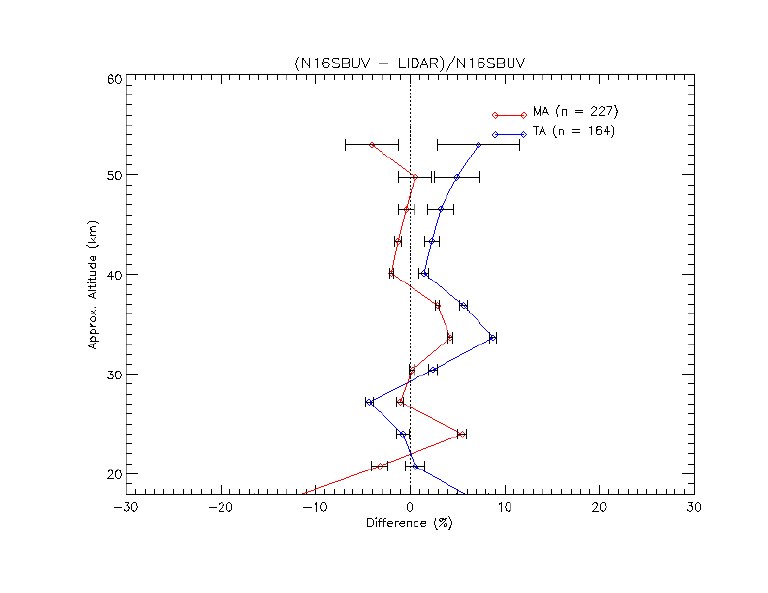
The V8 SBUV profile ozone data are validated using ground-based data (microwave, LIDAR, and ozonesonde) with independent calibrations and derivation methods at various locations around globe. Microwave and LIDAR data are available from NDSC . Ozonesonde data are archived in World Ozone and Ultraviolet Radiation Data Center(WOUDC). The first two initials of the names of stations are used as legends on the plots as follows;
Microwave: LA(Lauder), MA(Mauna Loa), TA(Table Mt).
Lidar: OH(OHP), MA(Mauna Loa), TA(Table Mt).
Sonde: HO(Hohenpeissenberg), PA(Payerne), WA(Wallops Island), HI (Hilo).
Leblanc, T., and I. S. McDermid, Stratospheric ozone climatology from lidar measurements at Table Mountain (34.4N, 117.7W) and Mauna Loa (19.5N, 155.6W), J. Geophys. Res., 105, 14,613-14,623, 2000.
McPeters, R. D., D. J. Hoffman, M. Clark, L. Flynn, L. Froidevaux, M. Gross, B. Johnson, G. Koenig, X. Liu, S. McDermid, T. McGee, F. Mucray, M. J. Newchurch, S. Oltmans, A. Parrish, R.Schnell, U. Singh, . J. Tsou, T. Walsh, and J. M. Zawodny, Results from the 1995 stratospheric ozone profile intercomparison at Mauna Loa, J. Geophys. Res., 104, 30,505-30,514, 1999.
Tsou, J. J., B. J. Conner, A. Parrish, R. B. Pierce, I. S. Boyd, G. E. Bodecker, W. P. Chu, J. M. Russell III, D. P. J. Swart, and T. J. McGee, NDSC millimeter wave ozone observations at Lauder, New Zealand, 1992-1998: Improved methodology, validation, and variation study, J. Geophys. Res., 105, 24,263-24,281, 2000.
 Profile Ozone QC Flagging Plot
 V8 SBUV Profile - Dobson Total Ozone
 Seasonal variations of layer ozone at four altitudes
 Time Series Analysis of the Ratio (Microwave/V8SBUV)