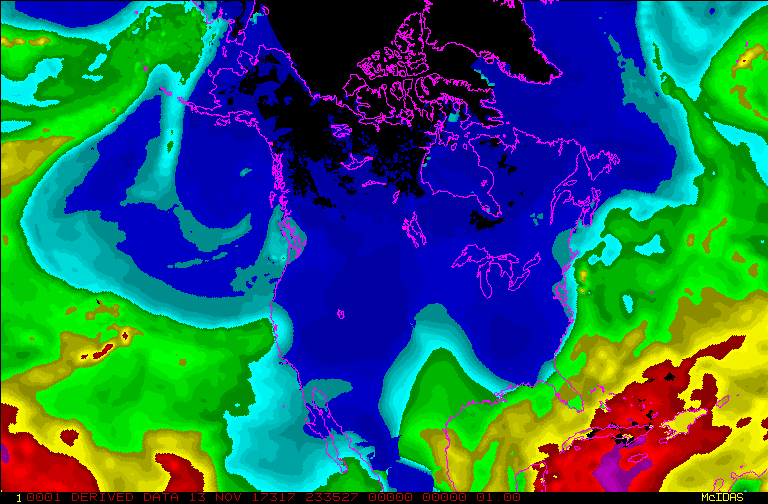
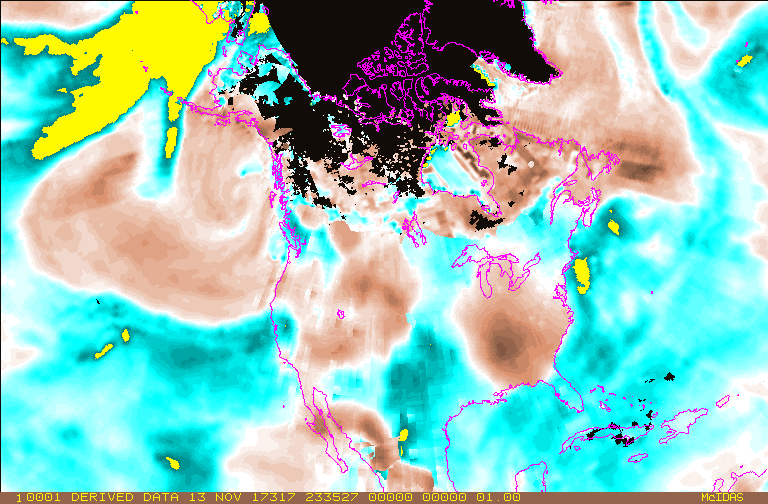
Blended Total Precipitable Water (bTPW)
Algorithm Description
Currently, the TPW products are available from various sensors/satellites. However, these products carry different biases and sampling errors due to the difference in algorithms, instruments, and also temporal and spatial sampling resolutions. What would be helpful, especially to forecasters, is a unified, meteorologically significant TPW field, which merges all available TPW products, with a non-gap global coverage. Colorado State Univ., CIRA, has developed such a product through blending AMSU, SSM/I and GPS TPW together. This product has being used by forecasters and satellite analysts for years, and approved its value on helping forecasters to analysis and forecast heavy rain and flooding, and also the transfer of moisture from ocean to land. NESDIS now has, in collaboration with CIRA, transitioned the TPW and TPW anomaly products developed at CIRA into operation, and tailor them to fit the requests of different end users, such as, AWIPS format over desired AWIPS regions for NWS users, McIDAS format for NESDIS/SAB, and PNG/GIF images for Science On A Sphere users.
The blended Total Precipitable Water (TPW) product is derived from several data sources. These include Special Sensor Microwave Imager Sounder (SSMIS) passes from the Defense Meteorological Satellites Program (DMSP), and the Advanced Microwave Sounding Unit (AMSU) from Polar Operational Environmental Satellites (POES) and Metop, and information from Global Positional Satellite (GPS) meteorological data, GOES-West and GOES-East Sounders will be used to fill in missing land locations over the continental United States. By combining all of these observations, a smooth product is created. The blended product provides information over the continental United States (primarily from GPS data) and over observation poor regions, such as the oceans, from the SSMIS, and AMSU data. The blended TPW eliminates the bias between data sets and provides an easier and faster product to analyze.
The Percentage of TPW normal, or TPW anomaly, shows the percentage departure from the climatology. The normal value is based on a weekly climatology of total precipitable water that comes from NASA's Water Vapor Project (NVAP). The data used to derive the climatology is from 1988-1999. The TPW anomaly assists forecasters to answer the question, "How unusual is the moisture field?" Very high percentage values (200% or more) indicate a strong flooding potential or a possible severe weather indicator, while low values indicate potential fire hazards.
Main Applications:
The TPW and TPW anomaly are mapped to a map projection useful to forecasters and then composited, by either averaging or latest value, with the latest 12 hour worth of data to make a global map. These maps are produced hourly using Data Processing and Error Analysis System (DPEAS). The products are output with a Mercator projection with 16-km resolution at the equator. The map is centered at the equator and 160°W. It has 1437 lines and 2500 elements, which covers the earth from about 71°N to 71°S. The cut line is at 20°E, which was chosen to emphasize ocean areas. The gridded products are converted into McIDAS format for NESDIS Satellite analysts and are also sectorized into 4 AWIPS regions (Super National, Alaska, Hawaii, Puerto Rico) for NWS forecasters.
Key Users:
- NOAA/NWS/Forecast offices and national centers.
Algorithm PI
Principal Investigator
Ralph Ferraro, NESDIS/STAR
Operational Product Access
Monitoring and Algorithm Support
List of satellite/instruments for algorithm
- NOAA-18
- NOAA-19
- Metop-A
- Metop-B AMSU-A
- Metop-B AMSU-B
- DMSP
- F-16
- F-17 SSMIS
- GCOM-W1 AMSR-2
- GPM GMI
- GOES-E
- GOES-W


