
Ocean Topography and Cryosphere Branch / Laboratory for Satellite Altimetry / Sea Level Rise
Global sea level time series
The following tables provide estimates of sea level rise based on measurements from satellite radar altimeters. Plots and time series are available for TOPEX/Poseidon (T/P), Jason-1, Jason-2, Jason-3, and Sentinel-6MF, which have monitored the same ground track since 1992, and for most of the altimeters that have operated since 1991, including T/P, Jason-1, Jason-2, Jason-3, ERS-2, GFO, Envisat, and Sentinel-3A/B.
Only altimetry measurements between 66°S and 66°N have been processed. An inverted barometer has been applied to the time series. The estimates of sea level rise do not include glacial isostatic adjustment effects on the geoid, which are modeled to be +0.2 to +0.5 mm/year when globally averaged. The plots have been smoothed with a 4-month boxcar filter.
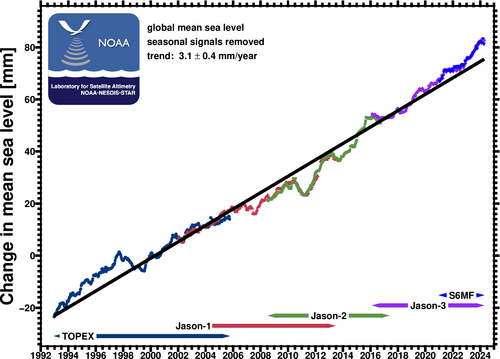
Global mean sea level from TOPEX/Poseidon, Jason-1, Jason-2, and Jason-3
| Region | TOPEX, Jason-1,-2,-3, and Sentinel-6MF | Multiple altimeters | ||
|---|---|---|---|---|
| Seasonal signals retained | Seasonal signals removed | Seasonal signals retained | Seasonal signals removed | |
| global mean sea level | Text (CSV) (38 kB) NetCDF (29 kB) pdf (60 kB)  png (142 kB) 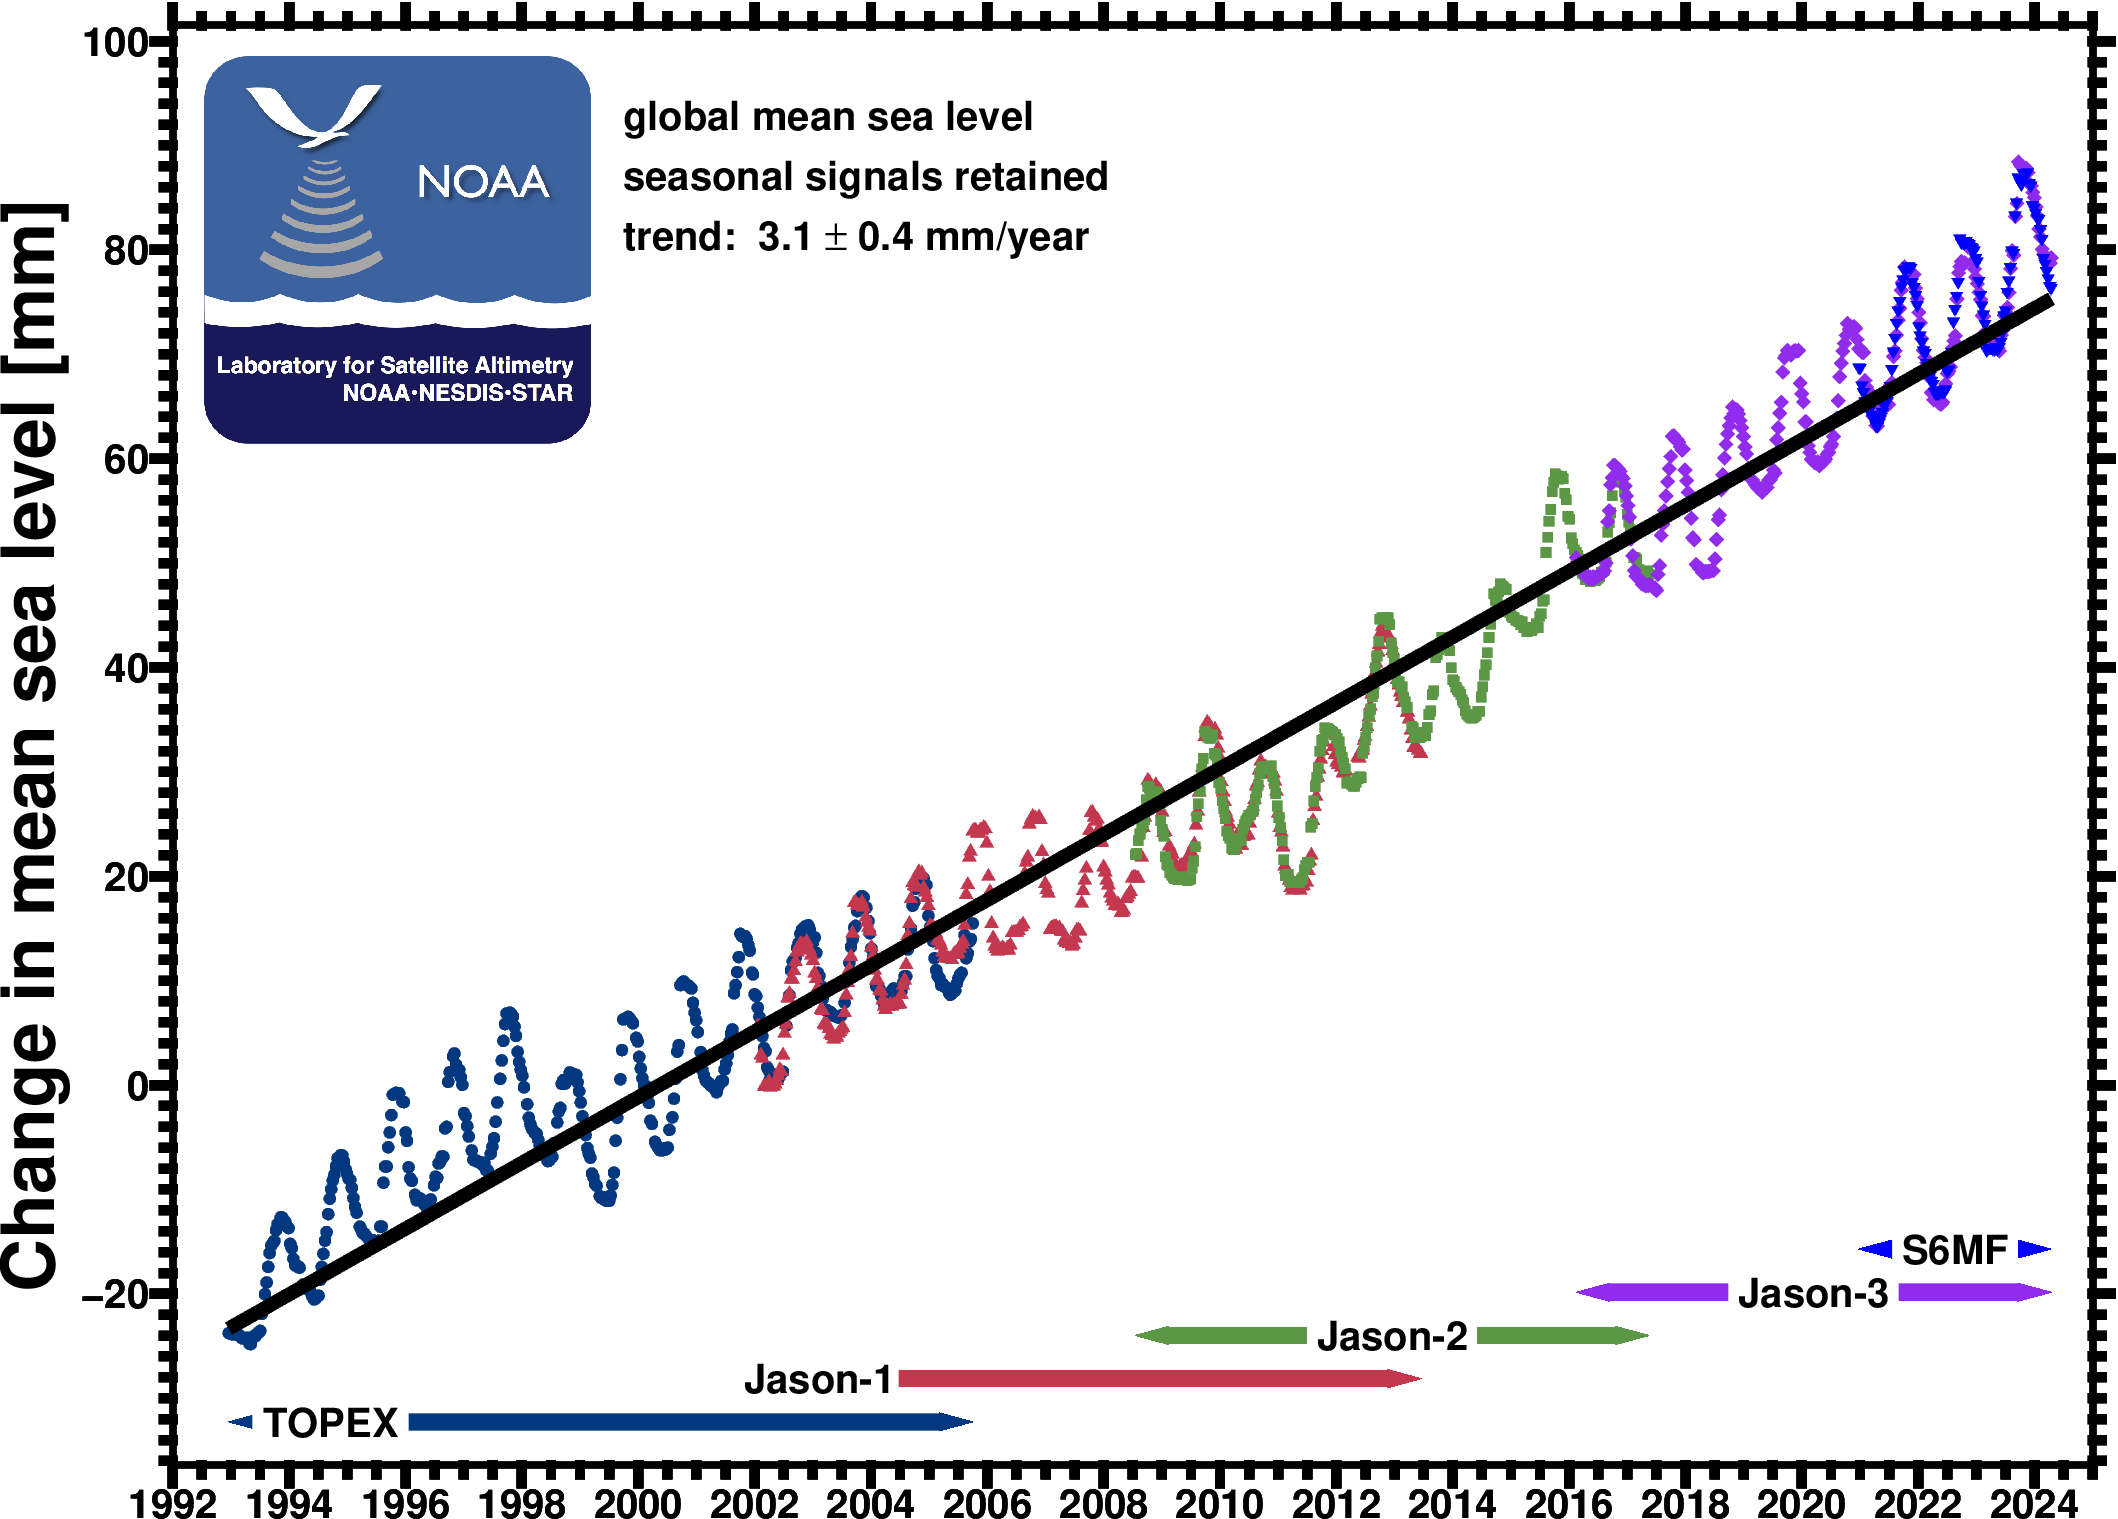 |
Text (CSV) (38 kB) NetCDF (29 kB) pdf (59 kB) png (108 kB)  |
Text (CSV) (38 kB) NetCDF (54 kB) pdf (110 kB) png (188 kB) 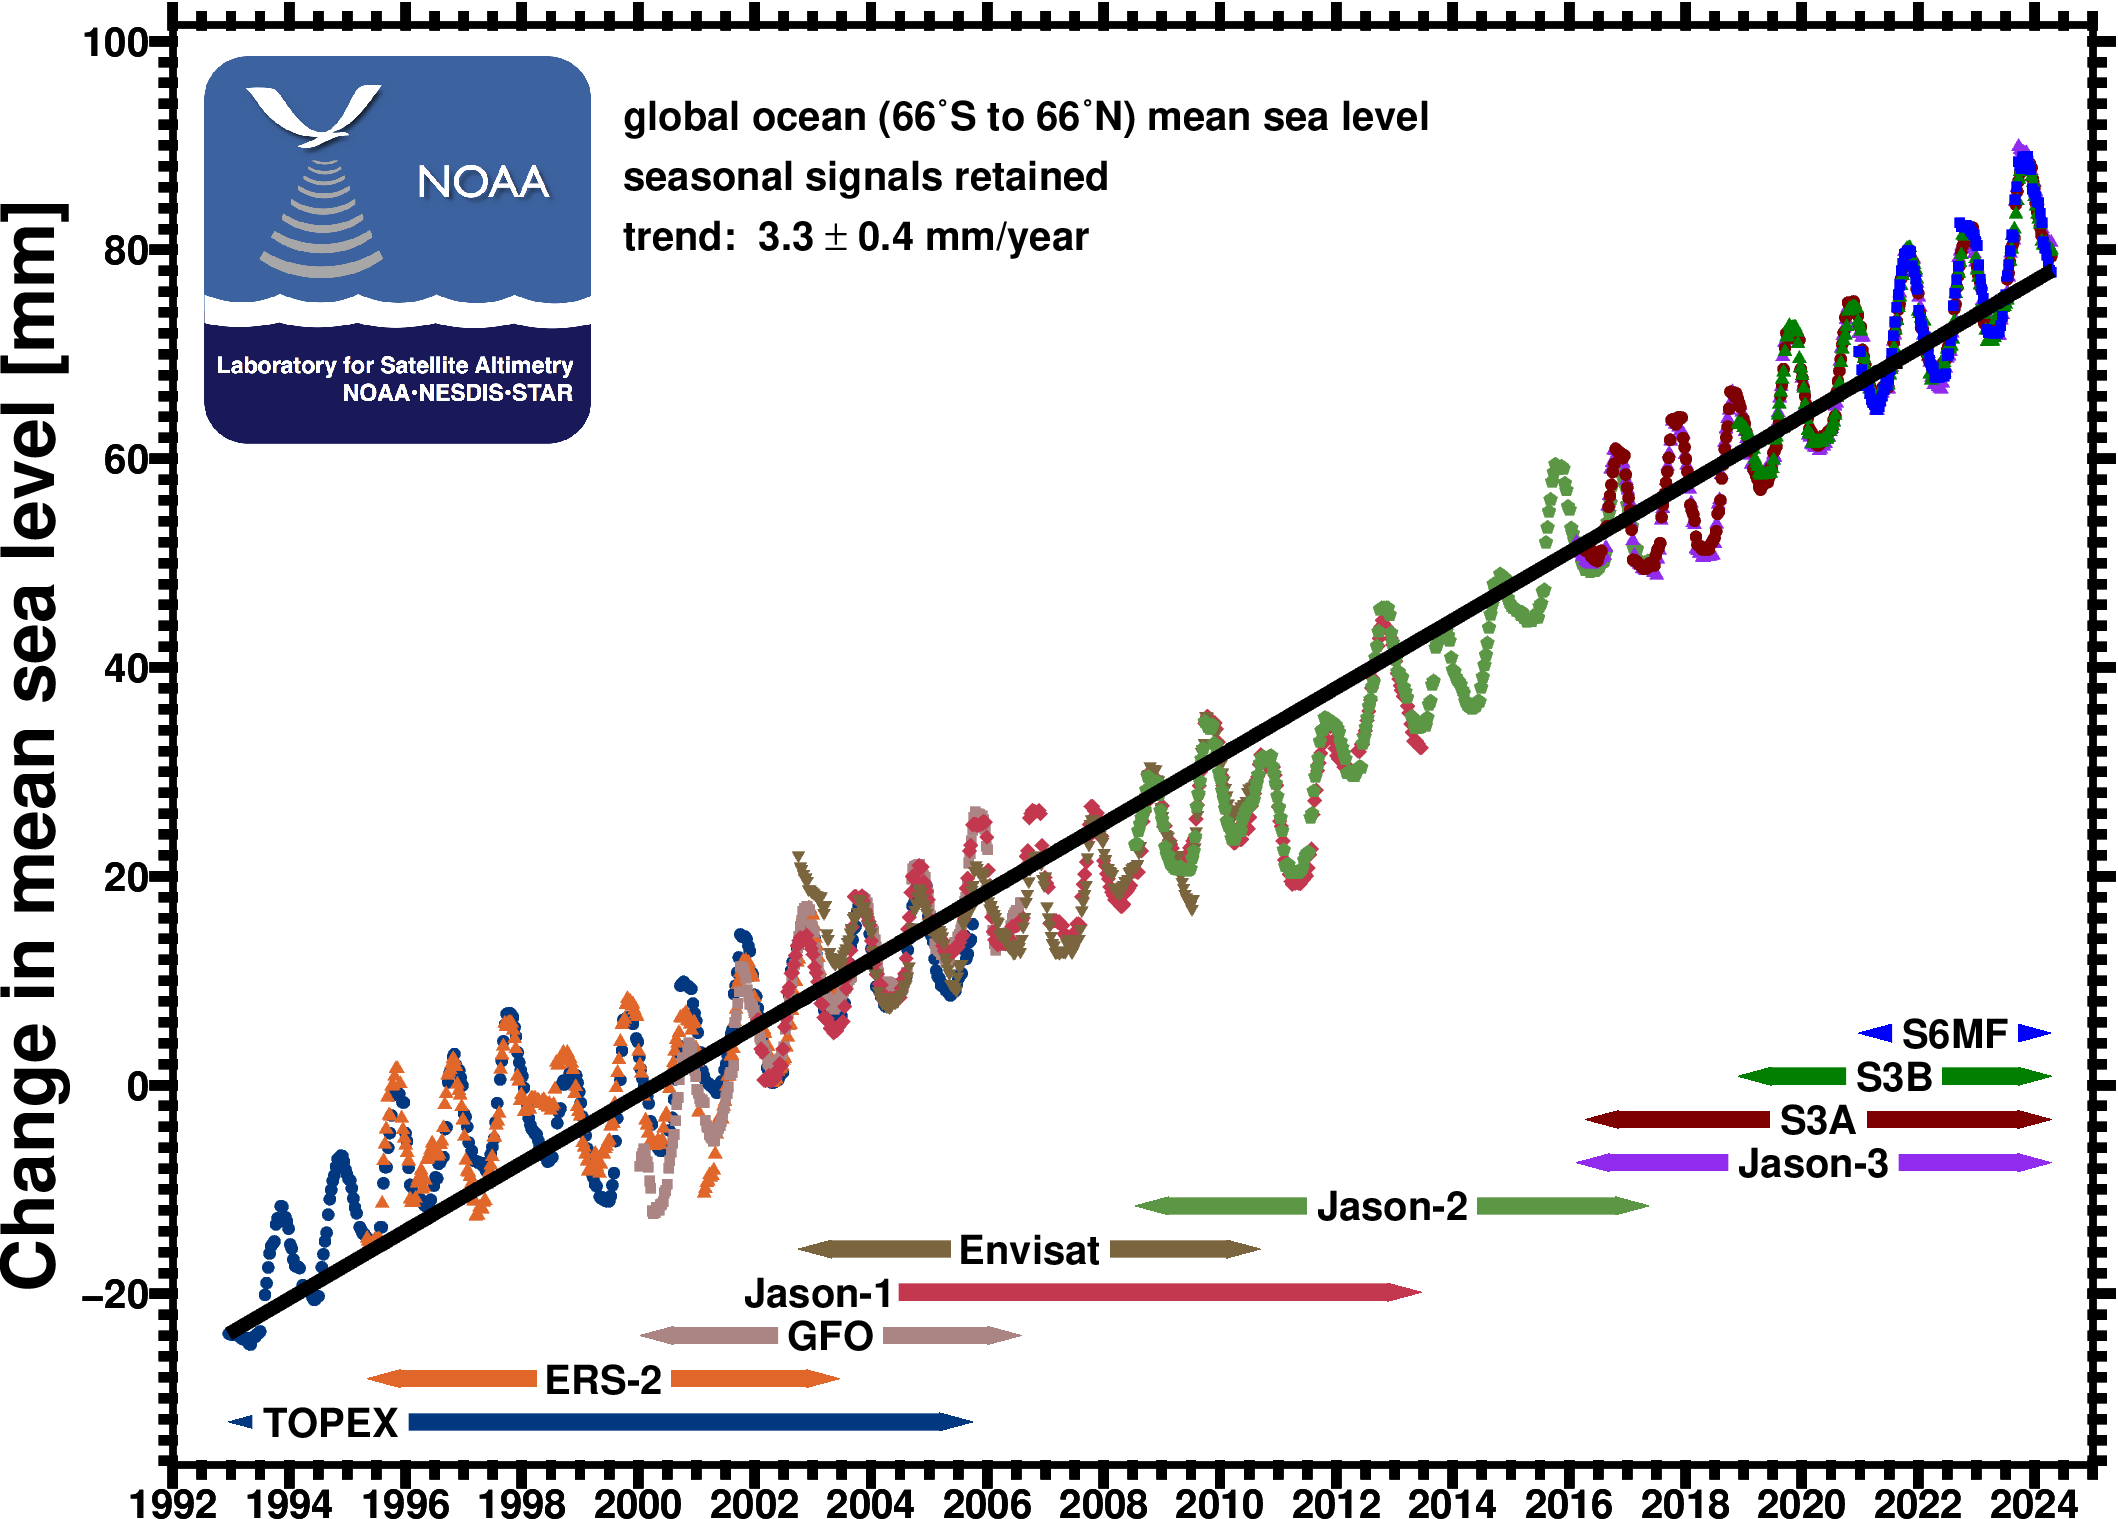 |
Text (CSV) (38 kB) NetCDF (54 kB) pdf (108 kB) png (135 kB) 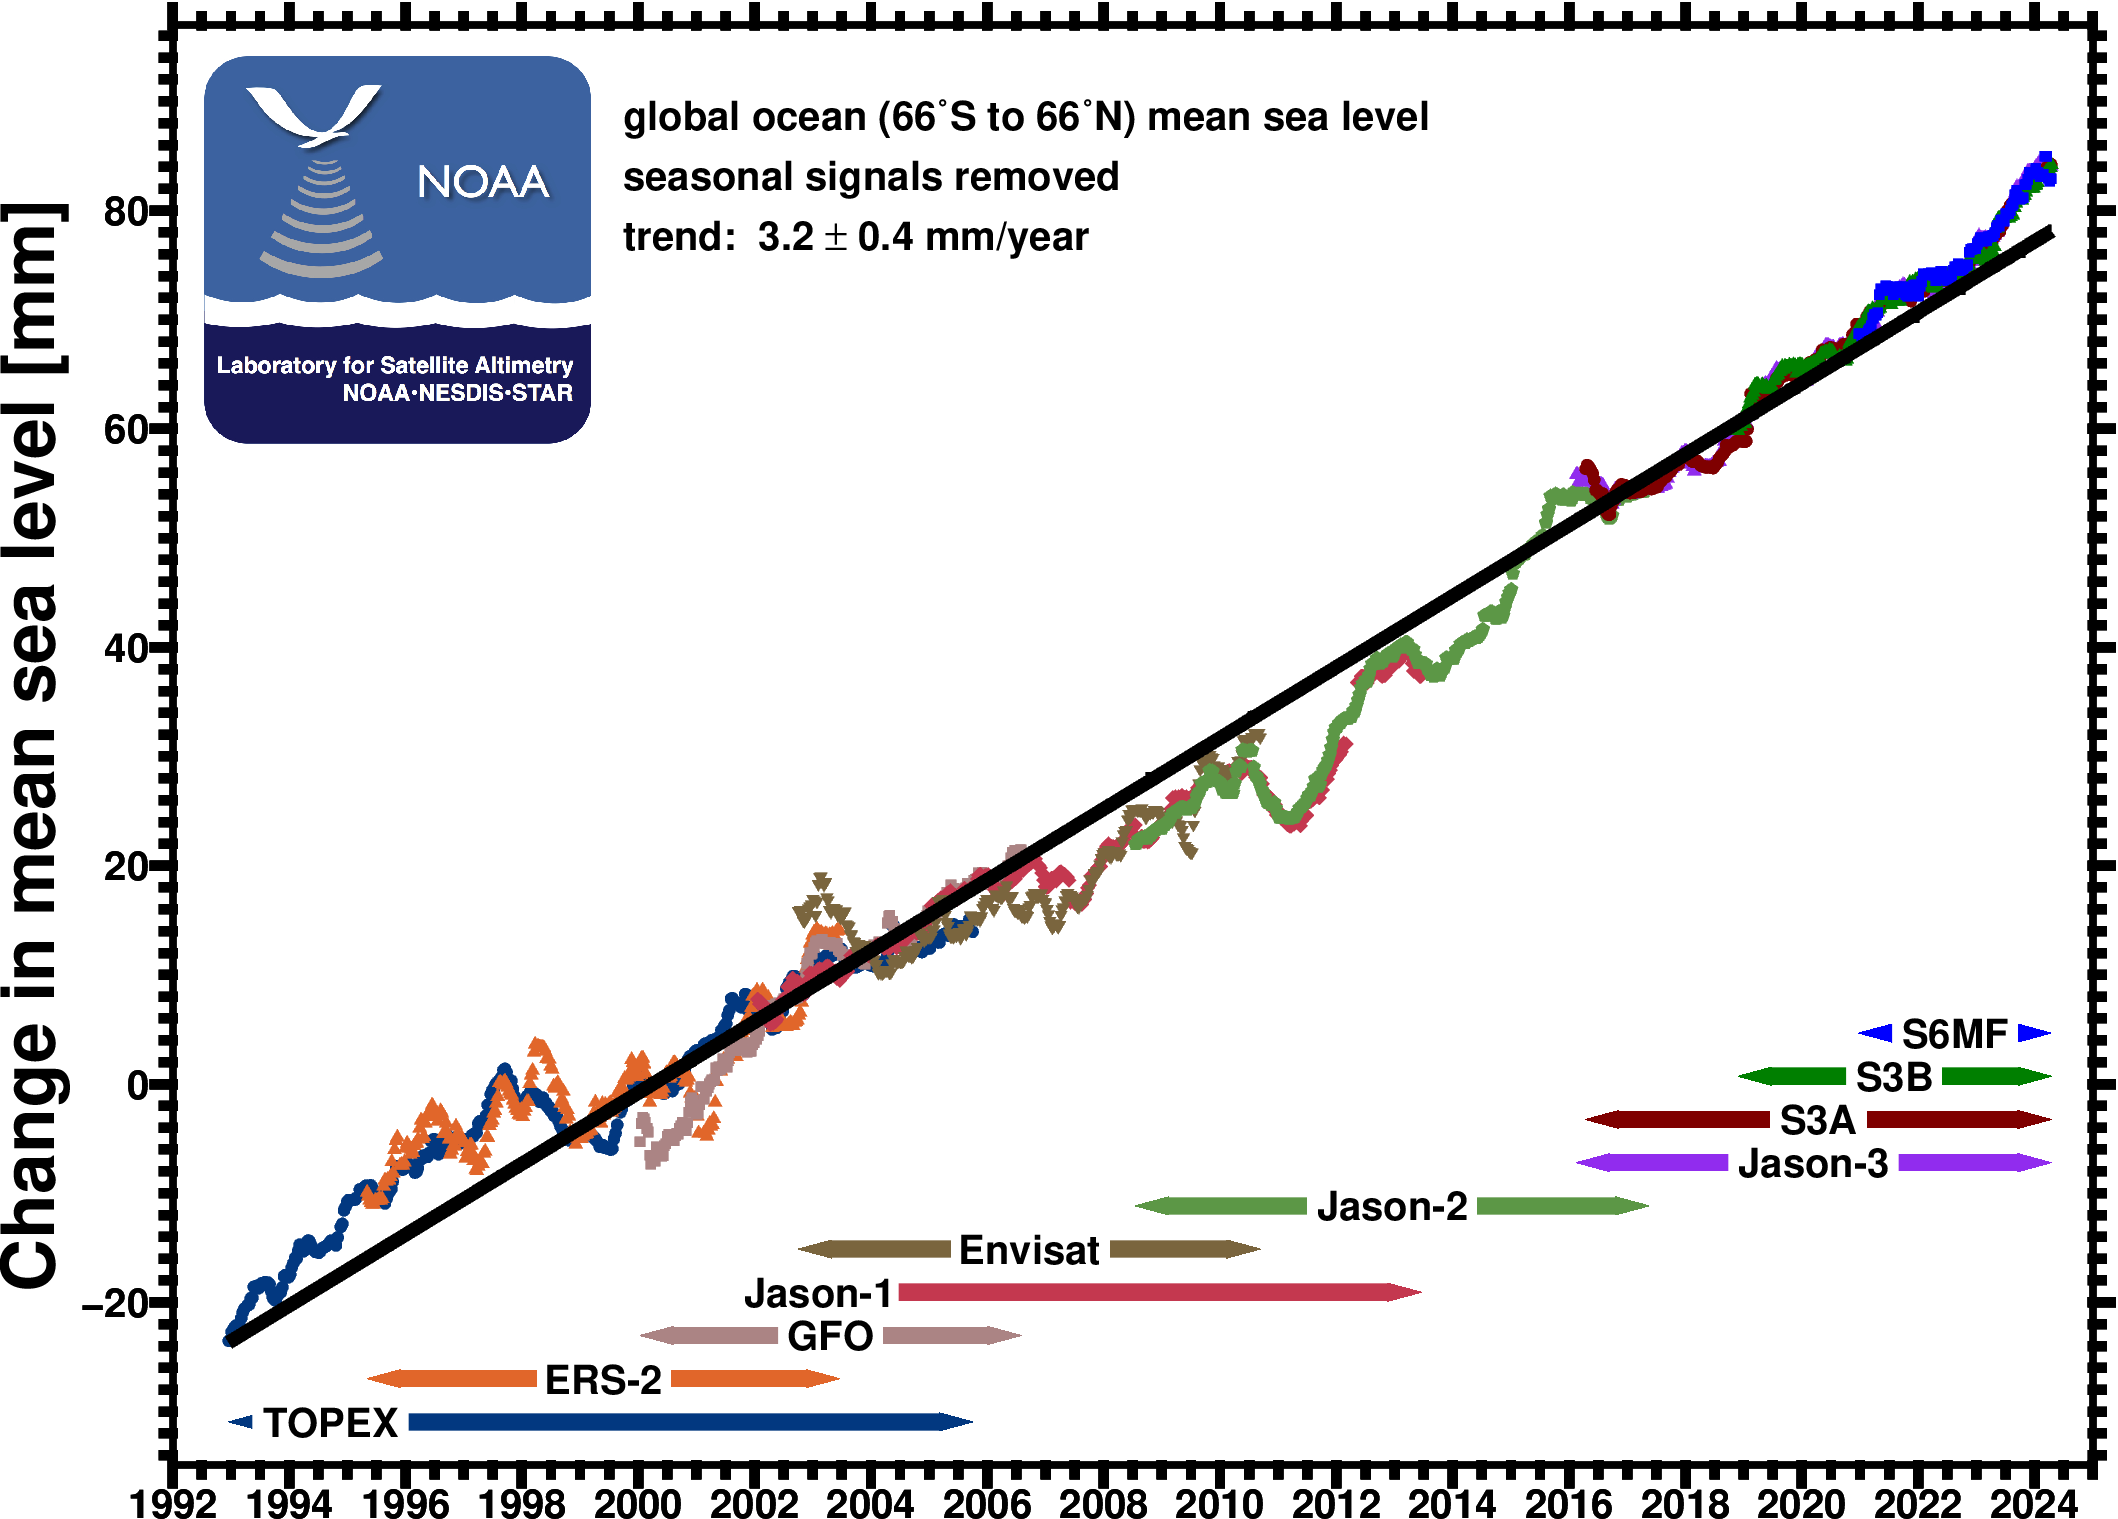 |