
About Ocean Color Viewer
Introduction
The Ocean Color Viewer (OCView for short) is designed for an interactive display of various ocean color data products generated by NOAA/NESDIS/STAR Ocean Color Team from the data acquired by the Visible Infrared Imaging Radiometer Suite (VIIRS) instrument onboard the Suomi National Polar-orbiting Partnership (SNPP) satellite. OCView relies on OpenLayers 3 JavaScript library for interactive display of tiled imagery. It also uses Bootstrap and jQuery JavaScript libraries. An article by Mikelsons and Wang (2018) on OCView was featured in EOS Buzz and published in EOS on May 1, 2018.
Page Layout
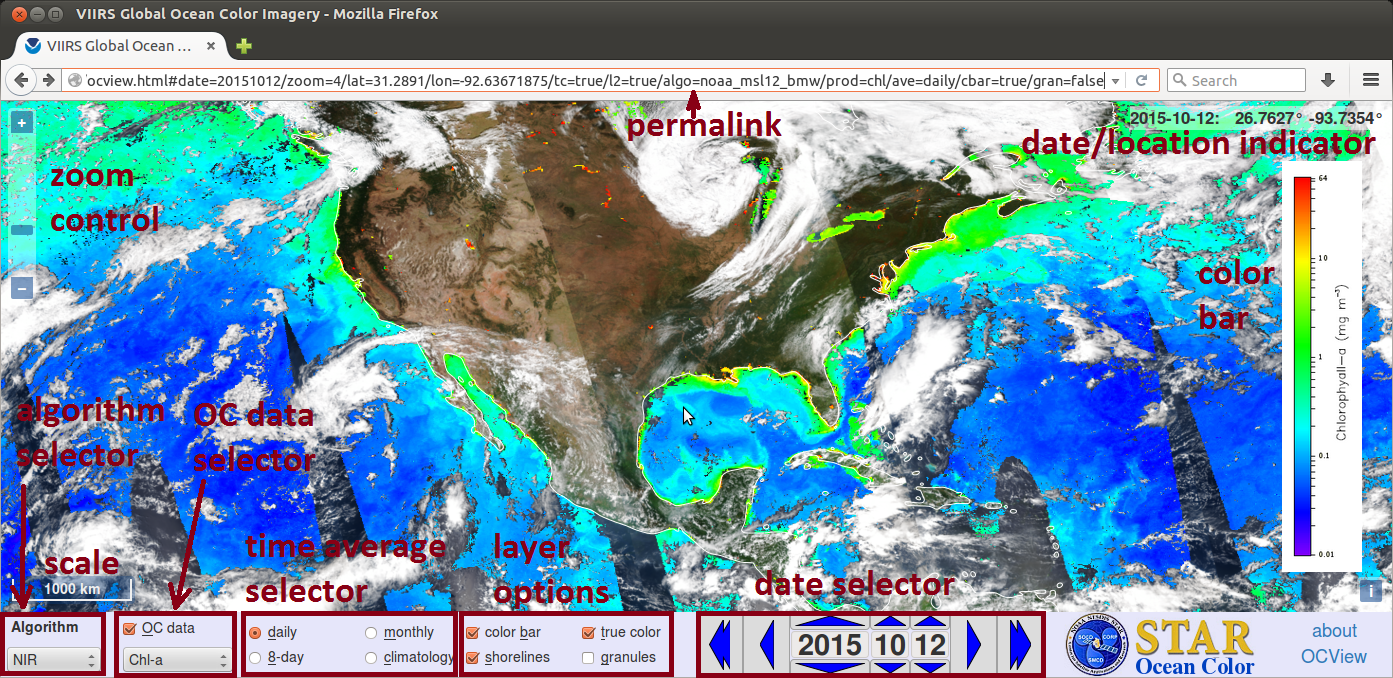
The main part of the OCView page is occupied by the map, which includes a zoom control (top left corner) and scale indicator (bootom left corner). It also includes a date/location indicator in the top right corner, showing the date and the geographic location corresponding to the cursor position on the map. In addition, an optional color bar can be displayed as a legend for the ocean color data on the right side of the map. All data are shown in the Geographic Projection (also known as Equidistant Cylindrical, and EPSG:4326). The user can pan and zoom in and out the map to select a scene of interest.
The panel on the bottom of the OCView page allows selection of the particular type of data to be displayed,
and to change the date for display by using the date selector.
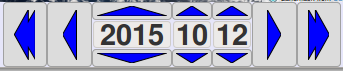 The large single arrows on the left and the right sides of the date selector allow to switch to the
previous and the following days, respectively. The large double arrows have a similar function to switch
8 days forth or back in time. The smaller arrows on the top and the bottom of the date allow to select the
next or the previous year, month, or date. The time range in date selector is restricted to the dates between the
beginning of VIIRS-SNPP mission (2011-11-21) and the current date.
The large single arrows on the left and the right sides of the date selector allow to switch to the
previous and the following days, respectively. The large double arrows have a similar function to switch
8 days forth or back in time. The smaller arrows on the top and the bottom of the date allow to select the
next or the previous year, month, or date. The time range in date selector is restricted to the dates between the
beginning of VIIRS-SNPP mission (2011-11-21) and the current date.
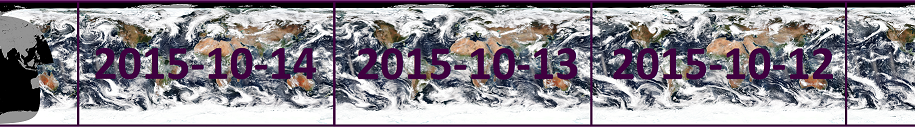
The map shows daytime data from different days side by side, with the previous day on the right (east) side and the following day on the left (west) side. This allows a continuous display of data near 180th meridian. Panning the map 360 degrees of longitude east (right direction) shows the same location on the previous day, and similarly panning the map 360 degrees of longitude west (left direction) shows the same location on the following day.
Any selection of the options, as well as date and center position of the map are stored in the updated permalink of the webpage displayed in the browser address bar. The permalink contains all the necessary information to restore the particular view, and is easy to share or store, without the need to make a copy of the particular imagery. The data displayed in OCView are periodically updated to reflect the continuous quality improvement of the ocean color products. The permalink allows to always access the most recent and up-to-date version of the particular data, and therefore is the recommended and preferred way of sharing the OCView imagery.
Data Layers
OCView can display five data layers. These layers, in the order from the base layer to the top layer, are: landmask, true color, ocean color data, shorelines, and granule boundaries. The four top layers can be independently switched on and off using the checkboxes on the lower panel. This enables the user to select a nearly arbitrary combination of layers.
- Landmask
The landmask data are obtained from USGS LP DAAC. These data are sampled to 15 arc second latitude and longitude resolution (at the finest zoom level presented in OCView). This corresponds to 460m resolution near equator. This base layer is always enabled, but may be covered by other layers (such as true color). Since ocean color products are not derived on land, landmask is a complementary layer to the ocean color data. Thus, the ocean color data products are often displayed together with the landmask. The landmask is a static data layer, as it does not change from day to day.
- Shorelines
The shorelines data layer is displayed on top of the true color and the ocean color data layers, and can be used to emphasize the land - water boundaries in these data. As the landmask, the shorelines is a static data layer. The shoreline layer uses the generalized coastline data from OpenStreetMapData (license). In contrast to the landmask, these data do not include inland waters, nor some of the estuaries. Another difference stems from the fact that the landmask does not include the polar regions always covered in ice, while the shoreline layer includes the perennial ice around Greenland and Antarctica.
- True Color
The true color is a very rich data layer with many uses for both land and ocean research. Over oceans, the true color data allows to identify clear sky areas, areas with high sun glint, and various other conditions. The true color imagery is obtained from VIIRS-SNPP Rayleigh-corrected top-of-atmosphere (TOA) reflectance data, and yields a more complete daytime coverage - in contrast to the ocean color data products, which cannot be derived over cloudy skies, ice, areas of high sun glint, and other cases. However, true color provides only qualitative information about the particular scene. The true color imagery from the beginning of the VIIRS-SNPP mission (2011-11-21) till the end of year 2012 is generated from the NOAA ocean color Sensor Data Record (OC-SDR) with an improved calibration and geolocation data. The true color imagery from the year 2013 onwards is generated from SNPP VIIRS IDPS SDR. The Rayleigh-corrected TOA reflectances from the VIIRS-SNPP bands M3, M4, and M5 are used for blue, green, and red channels, respectively. The mapped true color data have roughly 40 arc second latitude/longitude resolution, which translates into about 1.2 km resolution in both directions near the equator. Polar regions with latitudes larger than 86 degrees are not mapped, as these regions are not well represented in the geographical projection. Also, only daytime data with solar zenith angle less than 86 degrees are mapped. This means that no true color data are available for high latitudes during the winter months due to the polar night. In areas where swaths from two or more VIIRS-SNPP orbits overlap, the data from the orbit with the smallest value of satellite zenith angle for the particular location are used. Borders between adjacent orbits can be seen in the true color imagery due to shifting clouds. The Rayleight-corrected TOA reflectance is also impacted by the changes in solar and satellite viewing geometry from one orbit to another.
- VIIRS-SNPP granules
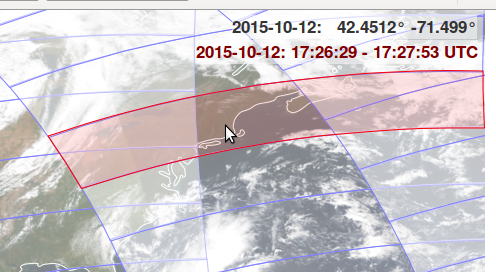
This layer shows the shape and boundaries of VIIRS-SNPP daytime granules. Although granule boundaries do not carry any physical information, they can be very useful to find the time of data aquisition and to identify the exact data file corresponding to the particular location on a given day. The granule boundaries are extracted from the VIIRS-SNPP Sensor Data Record (SDR) geolocation data. They correspond to the standard 85.35s data granules of the Raw Data Record (RDR). Due to many overlapping granules in the polar regions, granules for latitudes larger than 80 degrees are not shown. The date and the time interval of the granule selected by cursor are shown in the upper right hand side corner of the map area in red. These times are UTC. As the true color imagery, granule boundaries from the beginning of the VIIRS-SNPP mission (2011-11-21) till the end of the year 2012 are generated from the NOAA Ocean Color Sensor Data Record (OC-SDR) due to better geolocation data, while the granule boundaries for times from 2013 onwards are generated from VIIRS-SNPP IDPS SDR.
- Ocean Color Data
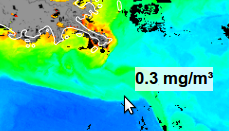
The ocean color data products are mapped from the binned data generated with OCDAPS l2bin and l3bin utilities. The finest level of the ocean color data is mapped from 1.25 minute latitude/longitude data bins (2.3 km resolution near equator). The coarser levels are mapped from 5 minute latitude/longitude bins. The color scale corresponding to the selected ocean color data product can be enabled or disabled with the corresponding checkbox (it will only show if "OC data" is also enabled).
If true color and granule layers are disabled while exploring the ocean color data products, approximate value of the data at the cursor position will be shown next to the pointer. These values are only approximate, and are intended only as an aid to estimate the values from the color bar, and therefore should not be regarded as the exact values of the ocean color data products.
Ocean Color Data Products
OCView shows the ocean color data products derived by the three algorithms and subject to four levels of time aggregation.
Algorithms and data streams
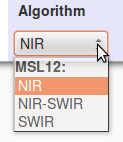
All ocean color data products are derived using the NOAA MSL12 software package. The OCView shows four data streams derived with three variations of MSL12, which use different spectral bands for the atmospheric correction:
NIR - uses near-infrared bands for the atmospheric correction. Details described by Gordon and Wang (1994) with the NIR water reflectance correction algorithm (BMW) by Jiang and Wang (2014).
NIR-NRT - This is a near-real-time data stream, processed with the same NIR algorithm, but generated from IDPS SDR data and model forecasted anciliary data.
SWIR - uses VIIRS-SNPP shortwave infrared (SWIR) bands M8 and M10 for the atmospheric correction. Details described by Wang et al (2007).
NIR-SWIR - uses a combination of both near and short wave infrared bands. For details, see Wang and Shi (2007).
All ocean color data products for NIR, SWIR, and NIR-SWIR data streams are derived from VIIRS-SNPP NOAA OC-SDR (Science Quality data) and science quality (assimilated) ancillary data. These science quality data start with the beginning of VIIRS-SNPP mission (SWIR and NIR-SWIR start on 2012-01-28), and are delayed for about five days from present. In contrast, the near-real-time data stream (NIR-NRT) starts on 2015-11-03, has only one day delay, but is derived from IDPS SDR and predicted anciliary data. Thus, the NIR-NRT data may not have the same accuracy as the other data streams. It is also noted that the SWIR data may still have some issues, in particular, significant noise over open oceans due to poor sensor performance at the SWIR bands. The standard official VIIRS ocean color products are produced using the NIR method.
Data Products
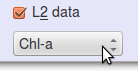
The ocean color data products are grouped by the algorithm maturity status into the Primary and the Experimental products. The most fundamental primary ocean color products are the normalized water-leaving radiances for different visible bands (denoted as nLw, followed by the nominal center wavelength of the corresponding band in nm). The other important primary products are the chlorophyll-a concentration (Chl-a), the water diffuse attenuation coefficient at 490nm (Kd(490)), and the water diffuse attenuation coefficient at the domain of the photosynthetically available radiation (PAR) (Kd(PAR)). Chl-a data are derived from the empirical algorithm described by O'Reilly et al (1998), with coefficients tuned for the VIIRS-SNPP spectral bands (OC3V). Kd(490) data are derived using the algorithm described by Wang et al, and Kd(PAR) data are from Son and Wang (2015). All primary products are post-processed to remove striping using the algorithm described by Mikelsons et al and available for download here.
Most of the experimental data products are the water inherent optical properties (IOP), derived from VIIRS-SNPP normalized water leaving radiances (nLw) using the quasi-analytical algorithm described by Lee et al. The IOP products are: a(443), aph(443), adg(443), bb(443), bbp(443), a(551), and bb(551). The other experimental products are chl_a_OCI (chlorophyll-a concentration derived by OCI algorithm, details by Hu et al), and PAR (photosynthetically accessible radiation). derived by an algorithm described by Frouin et al. PAR does not depend on the atmospheric correction algorithm, therefore all three algorithms used in MSL12 produce the same PAR.
Not all atmospheric conditions are suitable for retrieval of the ocean color data. Certain conditions can affect the accuracy of ocean color retrieval algorithms, or even make any such retrievals impossible. Thus, daily and other time aggregated products shown in OCView are restricted to use only those times and locations where good ocean color retrievals were possible. For all ocean color products, exept PAR, any of the following conditions will result in no data for the particular time and location:
- failure of atmospheric correction algorithm,
- land or ice,
- high sun glint,
- satellite zenith angle larger than 60 degrees,
- solar zenith angle larger than 70 degrees,
- clouds,
- cloud shadows and straylight,
- navigation failure,
- failure of chlorophyll-a algorithm.
Not all products are derived by all three algorithms: The normalized water leaving radiances for the NIR bands [nLw(746) and nLw(865)] are only derived by the SWIR and NIR-SWIR algorithms. PAR data are only derived by the NIR-SWIR algorithm (they are same for other algorithms).
Time Aggregation

All products are shown for four levels of time aggregation: daily, 8-day, monthly, and climatology.
The daily products are generated from the data in the granules corresponding to the location and date. For locations near the equator, daily data come from a single VIIRS-SNPP orbit, while at higher latitudes, data from several overlapping VIIRS-SNPP orbits may contribute to the daily average.
The 8-day data are obtained as median values of the daily data over non-overlapping consecutive 8 day periods, starting from January 1st of each year. Thus, the last 8-day average in the year may actually contain data from 5 or 6 days, depending on if it is a leap year or not. The most recent 8-day average contains data from the last 8 days.
The monthly data are median values of the daily data products over the corresponding calendar months. The most recent monthly average contains data from the last 28 days.
The climatology data are obtained from the VIIRS mission-long data. They correspond to the median values of the monthly data sets. Since the NIR-NRT data stream only starts from 2015-11-03, the science quality climatology from the NIR data stream is also used for the NIR-NRT data stream.