
NPROVS Conventional Summary Plots
Conventional observations refer to the ground truth radiosondes used for assessment, namely, the global synoptic radiosondes (and dropsonde) observations typically available at the mandatory and significant pressure levels.

NPROVS Conventional Station Map - click to enlarge
Summary Performance Trends
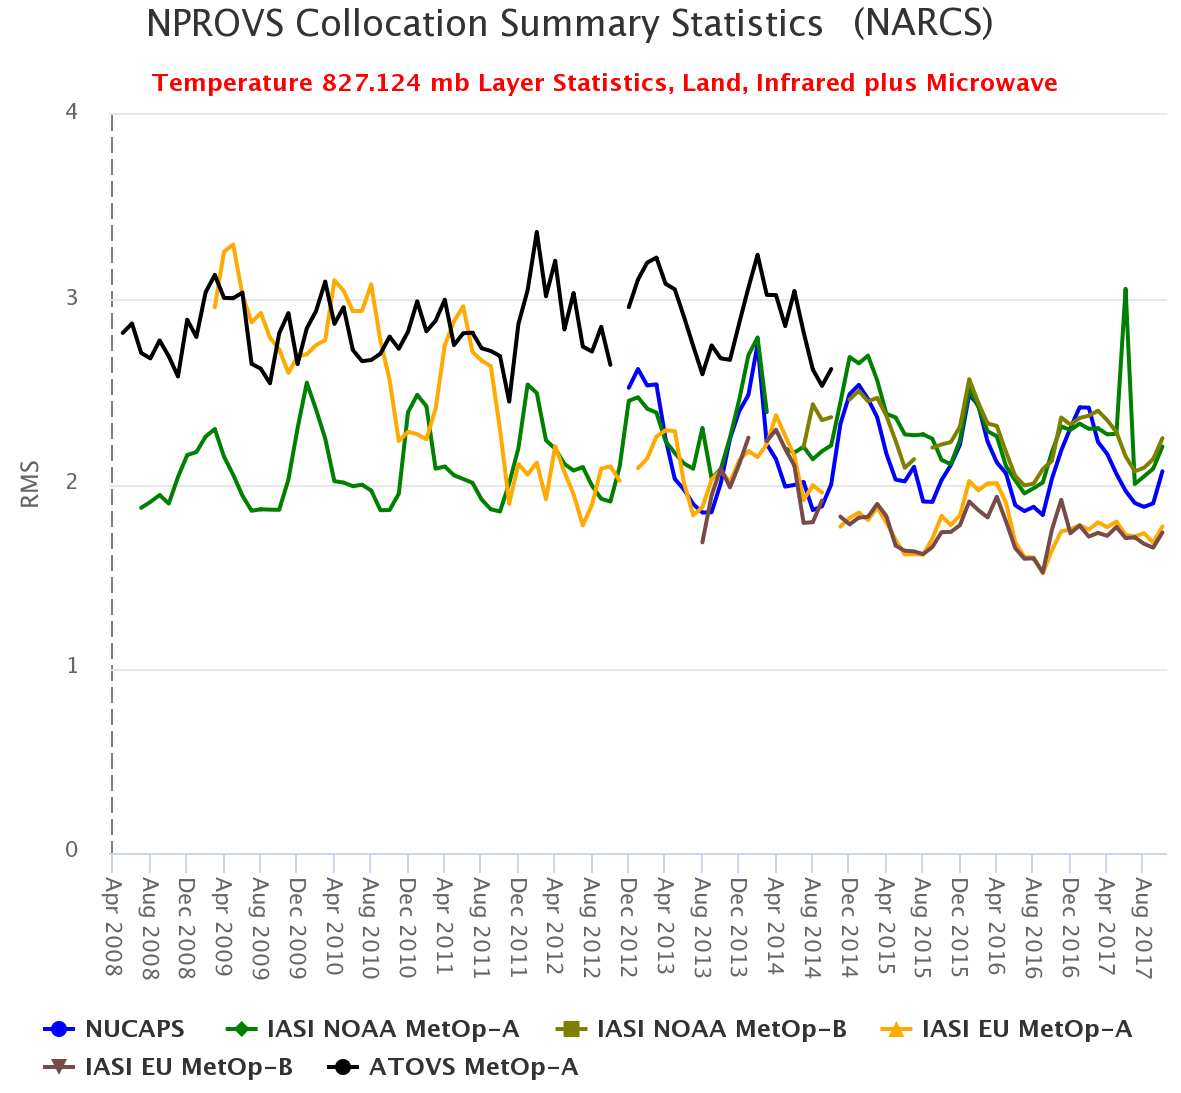
Summary performance trend plots are produced for a) each month (daily averages) and b)long term (monthly averages) since April 2008. Plots show SAT-minus-RAOB RMS statistics for Temperature and Water Vapor Fraction (%) for "coarse" pressure layers (effective pressure) for respective product suites (i.e., NUCAPS, MiRS, etc). Plots are segregated for maritime and non- maritime RAOB samples and IR+MW and MW-only sounding types, respectively. Plots represent independent (optimal) samples of respectively QC'd soundings from the following satellite combinations (and NWP):
- NUCAPS IR+MW
- NUCAPS MW-only
- MIRS and AIRS
- ECMWF, HRRR and COSMIC-2 (UCAR)
Performance trends are updated monthly
Click links below for monthly or long term trends: