Laboratory for Satellite Altimetry / Sea Ice and Polar Dynamics Science Team

Figure 1. Validation of the RA-2 radar altimeter onboard ESA's Envisat between 2006 and 2012. The Envisat under-flights are flown in the Canada Basin north of the Canadian Queen Elizabeth Islands. Also shown are an under-flight of CryoSat-2 in April 2010 (blue) near the North Pole, and an over-flight of the Danish GreenArc Ice Camp (red) where in situ data were gathered in April 2009.
 IceBridge 2011 & 2012 Flights
LSA/Sea Ice Research Group (SIRG) members serve on the NASA IceBridge Science Team and support planning of the biannual IceBridge Missions to survey the sea ice packs of the Arctic and Southern Oceans. These flight campaigns typically take place each year in March/April and October/November, respectively.
Jointly with NASA Goddard Space Flight Center, the POlar Sea Ice Thickness (POSIT) experiment conducted in 2011 and the Airborne Altimetric Survey of the Arctic and Antarctic (AASAA) sea ice experiment conducted in October 2011 and March 2012 continue to support the collection of a long-term time series of snow and sea ice thickness data in the Arctic and Southern Oceans. The goal is to continue the legacy of airborne campaigns conducted in prior years (e.g. LaRa FASIT 2002, AAA 2006, CBSIT 2009) to gather data across a range of seasonal and multi-year ice floes found in the Arctic and Southern Oceans. As part of the validation of the radar altimeter system ("RA-2") onboard European Space Agency's (ESA) Envisat, we have collected a time-series of data spanning 2006-2012 [Figure 1]. The Envisat under-flights are flown in the Canada Basin, which is a scientifically interesting area that tends to have a high concentration of the thickest multi-year ice floes found in the Arctic.
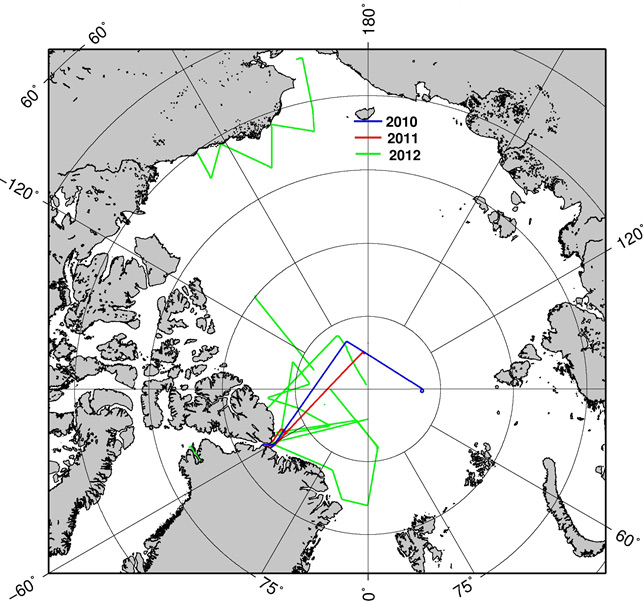
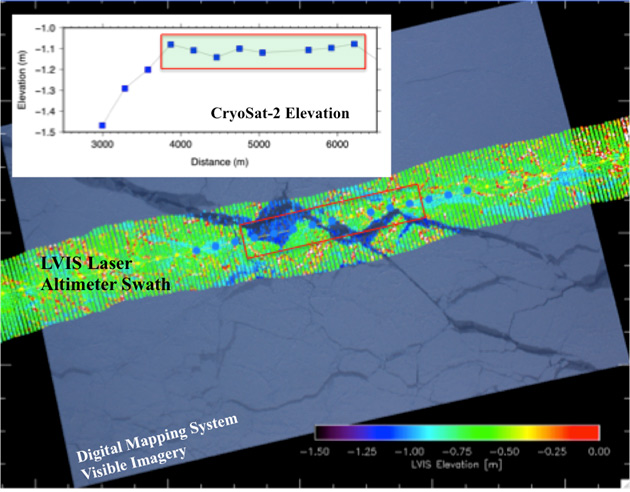
Figure 2. Validation of the advanced microwave satellite altimeter (SIRAL) onboard ESA's CryoSat-2 in 2010 (blue), 2011 (red) and 2012 (green). In this short, three-year period, nine under-flights of segments of CryoSat-2 orbits have been flown as part of the Operation IceBridge Mission in the Arctic, including the collection of data when SIRAL has operated in both SAR and SARIn modes.
While the ICESat mission ended in 2009, and the Envisat radar altimeter recently ceased operations in May 2012, data gathered over the ice-covered polar seas will continue to be analyzed as part of on-going studies. ESA's CryoSat-2 radar altimeter satellite has been operating successfully since 2010, and NASA plans the launch of ICESat-2 in April 2016, supporting continuity of the Arctic sea ice thickness time-series until at least the end of this decade.
The AASAA experiment was the first designed primarily to validate the advanced microwave satellite altimeter (SIRAL) on CryoSat-2. AASAA included an IceBridge under-flight of CryoSat-2 over Antarctic sea ice in the Weddell Sea in October 2011, and six temporally-and-spatially coincident under-flights of CryoSat-2 over Arctic sea ice across the Western Arctic Basin in March 2012. Figure 2 shows the location of nine under-flights of CryoSat-2 conducted jointly with the NASA Operation IceBridge Mission between 2010 and 2012. The high-resolution datasets gathered during the Operation IceBridge flights are used as a calibration and validation tool to understand the accuracy of CryoSat-2 sea ice elevation estimates [Figure 3].