- STAR Home
- > 2009
News
- > CIRA's CloudSat Data Processing Center Captures Unique Typhoon Overpass
CIRA's CloudSat Data Processing Center Captures Unique Typhoon Overpass
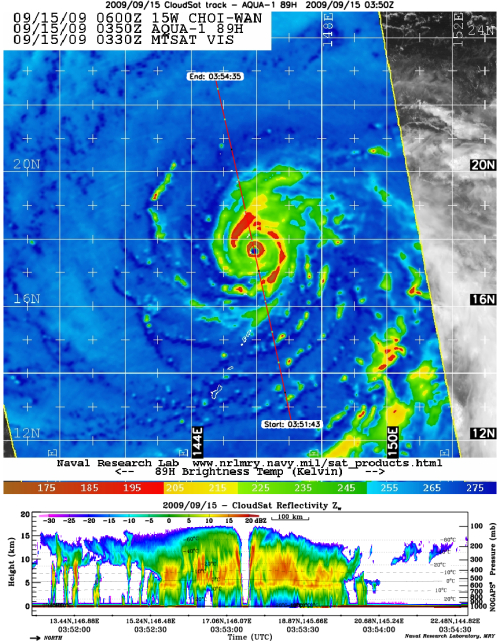
Top: Eye overpass image of Typhoon
Choi-Wan Showing CloudSat Path, 9-15-2009
Bottom: Chart Plotting Reflectivity Against Height
Top: Eyewall crossing of Typhoon Choi-Wan on 9-15-2009,
showing CloudSat groundtrack (red line) overlaid upon Advanced
Microwave Scanning Radiometer (AMSR-E) 89 Gigahertz brightness
temperatures (colors; with yellow/red denoting regions of high ice
scattering in the eyewall and feeder bands). Bottom: CloudSat
reflectivity along the groundtrack plotted against height. Red colors
denote regions of high radar reflectivity, corresponding to high water
content and large hydrometeors. The vertical region of zero
reflectivity denotes clearly the eye of the storm. Images courtesy of
the Naval Research Laboratory,
Marine Meteorology Division, Monterey CA.
Learn more about:
Special thanks to John Knaff and Mark DeMaria of CoRP,
Don Reinke, Mary McInnis-Efaw, Kathy Fryer, and Steven Miller of CIRA,
and Natalie Tourville at Colorado State University for their
assistance in preparing this story.
15 September 2009 - The Cooperative Institute for
Research in the Atmosphere's (CIRA's) CloudSat Data Processing Center
captured a rare direct overpass of the Typhoon Choi-Wan's eye by the
CloudSat satellite. This is an extraordinary event.
In the image at right, the thin red line from lower right to upper left
traces CloudSat's path directly over the cyclone's eye.
- How unusual is this view of a typhoon?
According to Don Reinke of CIRA: "I would call it rare.
CloudSat's swath is only 1.3km wide and it makes 14.5 orbital passes
per day, thus scanning only about 0.15% of the earth's surface; there
are 80 tropical storms per year lasting at least 1 day within 30
degrees of the equator; therefore, the odds of a direct overpass are
quite low. Based on over 3 years of data collected to date by the
CloudSat mission, scientists estimate that the odds are about 1 in
4,000 (0.025%) that the satellite's swath would pass directly over the
eye of a tropical storm."
- What can we learn from this observation and others like it?
CloudSat provides detailed vertical structure of clouds and
precipitation that is not available from standard visible/infrared
imaging platforms. It is analogous to the difference between
examining an injured body part using a camera and doing an exam with
an MRI device.
Despite 30 or so years or aircraft-based hurricane reconnaissance missions, we
still know little about cloud structure in hurricanes. Typical radar
is sensitive to rain-sized water droplets not cloud-sized droplets.
CloudSat can provide the first climatology of cloud structure in
tropical cyclones, and for that matter cloud distributions globally.
Questions concerning the location and percentage of convective vs.
stratiform, precipitating vs. non-precipitating clouds, the height of
the cloud tops in the eyewall, rainbands, and in the region adjacent
to the eye, "the moat region", can be quantified. Other issues like eye
slope, location of the freezing level, and ice/droplet distributions can
also be better understood and quantified. The answers to these
questions directly feed back on other efforts, including modeling,
through better understanding of the physical processes. While CloudSat
answers basic science questions, hopefully the findings will lead to
improvements in things like intensity, track and surface wind
structure forecasting.
- What projects at STAR / CIRA / CoRP will benefit from this data?
- CloudSat provides new insights into:
- The vertical distribution of liquid and ice water content;
- Probability of precipitation with respect to total cloud cover;
- Distribution of precipitating clouds;
- Frequency of occurrence of cloud layers and layer thickness;
- Heating/cooling rates with respect to vertical cloud distributions;
... to name a few.
CloudSat data are currently being used by developers of cloud
algorithms for the future GOES-R satellite mission, and have also be
used to validate the future NPOESS/VIIRS cloud base height algorithm.
All of these data provide a better understanding of derived
products from future visual/infrared/microwave imaging systems.
|