STAR Looks at the February 2010 Mid-Atlantic Blizzard
GOES-11/GOES-12 Water Vapor Composite Image
(click to see animation)
GOES-12 6.5 µm Water Vapor Images
+ Cloud-to-Ground Lightning Strikes
(click to see animation)
6 February 2010 - The Washington-Baltimore Metropolitan area experienced a second
powerful winter storm on 5 February-6 February 2010. STAR science
illuminates fascinating details of the storm from satellite observations
at the Cooperative Institute for Meteorological Satellite Studies
(CIMSS).
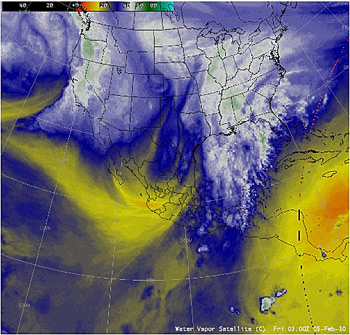
GOES-11/GOES-12 Water Vapor Composite Image
Top image / animation at right:
AWIPS images of 3-hourly composites of the GOES-11 and GOES-12 water
vapor channel data (top right) showed a strong disturbance originating over
the Pacific Ocean that was progressing eastward across the southwestern
US and northern Mexico during the days leading up to the storm. There
was also evidence of a plume of subtropical moisture seen on the water
vapor imagery.
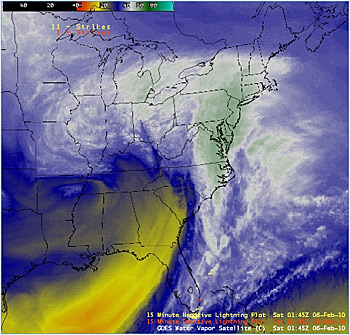
GOES-12 6.5 µm Water Vapor Images
+ Cloud-to-Ground Lightning Strikes
Second image / animation at right:
A time sequence of GOES-East Imager water vapor images with an
overlay of cloud-to-ground lightning strikes showed three important
phases of the storm: (1) a expansive area of cold cloud tops associated
with the initial round of heavy snowfall later in the day on 05
February; (2) the penetration of a dry air aloft over a broad region,
which helped to cause atmospheric instability along it's leading edge
that led to periods of thunder and lightning, and (3) a well-defined
frontal (or deformation) zone where additional snowfall banding
developed during the final hours of the storm. These images are from the
NWS's AWIPS display system. The lightning data were from a ground-based
system and were color-coded based on their polarity.
How big was the storm?
The highest storm total snowfall reported was 40.0 inches at Colesville
in Maryland. Washington Dulles International Airport received 32.4
inches of snow (their largest 2-day snowfall on record), and Baltimore-
Washington International Airport received 24.8 inches of snow (their
second-largest 2-day snowfall on record). So far, this is Philadelphia's
2nd- snowiest winter on record (56.3 inches) and Washington DC's 3rd-
snowiest winter on record (44.9 inches).
The Advanced Satellite Products Branch (ASPB) is part of the
Cooperative Research Program (CoRP) within STAR in NOAA's National Environmental
Satellite, Data, and Information Service (NESDIS). The Branch is co-
located with the Cooperative Institute for Meteorological Satellite
Studies (CIMSS) at the University of Wisconsin-Madison (UW) and
collaborates extensively with UW scientists.
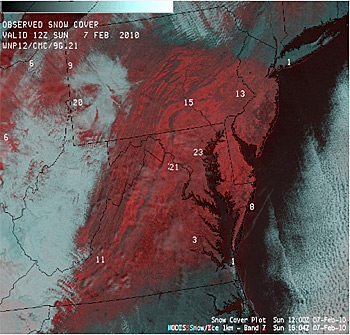
Observed Snow Cover - Sunday, 7 February 2010
MODIS visible + MODIS false-color
Red/Green/Blue (RGB) Image
(click to see animation)
Sunday, February 7, 2010
A comparison of a 1-km resolution MODIS visible channel image and a
false-color Red/Green/Blue (RGB) image (at right) shows the extent of the
snow cover on the morning of 07 February. On the RGB image, snow appears
as varying shades of red, in contrast to supercooled water droplet
clouds (which appear as brighter features). Even after compaction of the
heavy snowfall, there were still a number of sites reporting snow depths
in excess of 30 inches that morning.
According to Tim Schmit, "MODIS's unique spectral and spatial
attributes are preparing NWS forecasters, and others, for next
generation instruments." The GOES-R Proving Ground engages NWS and
other state and local offices in pre-operational demonstrations of
selected capabilities of next generation GOES.
Links
Special thanks to Tim Schmit of the CoRP / Advanced Satellite Products
Branch at the University of Wisconsin and Scott Bachmeier of the
Cooperative Institute for Meteorological Satellite Studies (CIMSS)
for assembling, supplying and describing these images.