- STAR Home
- > News &
Events
- > The GOES-R Algorithm Working Group Analyzes Satellite Views of the Tsunami and Flood in the Aftermath of the Japanese Earthquake
The GOES-R Algorithm Working
Group Analyzes Satellite Views
of the Tsunami and Flood in the
Aftermath of the Japanese Earthquake
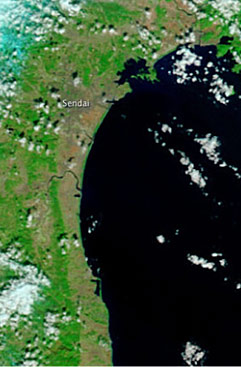
BEFORE: (left) MODIS Terra 250m composite image view acquired on February 26, 2011, before the Tsunami.
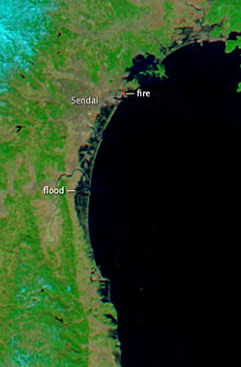
AFTER: (right) MODIS Aqua 250m composite image view acquired on March 13, 2010, after the Tsunami
16 March 2011 - In response to a request from the
NOAA tsunami coordination team, the GOES-R Algorithm Working Group
(AWG) land team performed a rapid analysis of the Japan tsunami and
flood which followed the massive earthquake that struck northeastern
Japan at 2:46 p.m. local time on 11 March 2011. The GOES-R ABI flood
and standing water (FSW) detection algorithm was applied to both the
MODIS Terra and Aqua data.
In the first set of images we can see a comparison of
the coastal area before and after the tsunami and subsequent flooding.
At left, a MODIS Terra 250m composite image view acquired on
February 26, 2011, before the Tsunami. At right, a MODIS Aqua 250m
composite image view acquired on March 13, 2011, after the Tsunami.
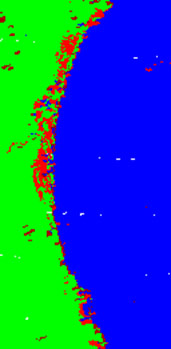
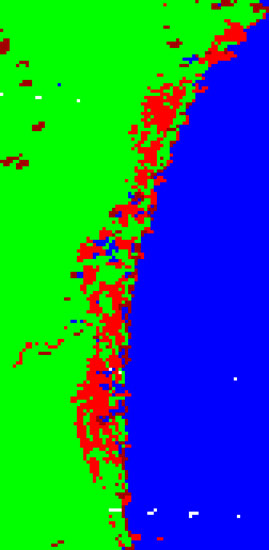
Color-coded views of the Japanese coast
after the earthquake and tsunami
Color-coded Images Illustrate Areas of Flooding after the Tsunami
The images at right show flood detection based on a comparison of
before and after images of the coastal area. The baseline image before
the tsunami was acquired from MODIS Terra 250m reflectance data acquired
on 01:20 February 26, 2011; the image after the tsunami was acquired
from MODIS Aqua 250m reflectance data acquired on 03:55 March 13, 2011;
The differences are based on the geolocation, which is provided by
MOD03. In the images above, the flooded areas are red, the land is
green, and permanent water is marked blue. The quick and accurate production
of these images using the FSW algorithm is a significant and successful test
of this new data product.
Special thanks to the efforts of Rui Zhang, Yunyue Yu and Donglian Sun
|
