2014 STAR Seminars
This page lists past seminars and presentations by STAR
scientists and visiting scientists. These seminars include the STAR
Science Forum and similar events. Presentation materials for
seminars will be provided when available.
All 2014 Presentations
| Speaker |
Professor Chris Merchant
University of Reading, UK |
| Title |
Not Yet Another Sea Surface Temperature Dataset
Presentation file posted here when available. |
| Date |
Tuesday, December 2, 2014
2:30 pm - 3:30 pm EST
5830 University Research Court, 4th Floor, Room 4552, College Park, MD 20740 |
| Abstract |
The goals of the talk are to explain the approach taken at
University of Reading to creating a climate data record (CDR) for
sea surface temperature (SST), and how our products are geared
towards the needs of climate science. The talks are focused around
issues of independence, stability, uncertainty, harmonisation,
diurnal cycle effects and compatibility with the longer-term
historical record for SST. In each case, the choices we have made
are oriented for CDR development, and so are a bit different to many
other SST datasets. The progress to date of the project (sponsored
under ESA's climate change initiative) will be presented.
|
| Speaker |
Robert Mason
University of Queensland (School of Biological Sciences) and the Hawaii Institute of Marine Biology |
| Title |
Informing coral bleaching prediction algorithm development through the use of physiological experiments
Presentation file posted here when available. |
| Date |
Tuesday, August 26, 2014
1:00 pm - 2:00 pm EST
5830 University Research Court, 2nd Floor, Room 2554-2555, College Park, MD 20740
|
| Abstract |
Coral bleaching, the expulsion of symbiotic dinoflagellates from
corals during stress, threatens tropical coral reef ecosystems. The
scientific consensus is that recent large-scale coral bleaching
events (over the past three decades) are the result of elevated
ocean temperature, frequently in combination with high irradiance.
Together these factors cause photosynthetic dysfunction in the
dinoflagellates within corals, leading to an inability to process
excess incoming light energy and a subsequent build-up of
photoinduced toxins in both symbiotic partners. Real-time prediction
methods for coral bleaching have utilized sea surface temperatures
detected by satellite-mounted radiometers, but until recently have
not incorporated irradiance. In addition, the thresholds used by
real-time bleaching prediction algorithms are based on correlations
of thermal events with field-observed bleaching patterns rather than
on physiological experimentation. In this talk I will present
experimental work to quantify the relationships between light,
temperature, bleaching severity and the timing of bleaching onset in
three species of corals from the Great Barrier Reef. I will discuss
how these data, and physiological experiments broadly, can be used
to inform the development of remote sensing algorithms for the
prediction of coral bleaching.
|
| Speaker |
Oscar Garcia-Pineda
Florida State University |
| Date |
Monday, July 28, 2014
2:00 pm - 3:00 pm EST
Conference Room #4552, 5830 University Research Court, College Park, MD 20740 |
| Title |
Fingerprinting Oil Thickness in Satellite Remote Sensing Imagery
- PDF version, no animations
|
| Abstract |
Monitoring oil spills with remote sensing is a well established
task. Recently, by combining hyperspectral and microwave satellite
images, we have learned that features associated with oil emulsions
can be detected with synthetic aperture radar (SAR) and optical-
infrared sensors. This is of great importance because during oil
spill events thick patches of hydrocarbons are the most toxic for
the marine environment, and it is these patches of thick oil that
can be most effectively recovered or treated during response
operations by burning, skimming, or use of aerial dispersants. In
this talk, we present our ongoing work and our latest results,
including the development of an algorithm that delineates thick oil
signatures in satellite imagery. This technique is validated in a
recent field campaign where oil samples were collected. The chemical
and spectral properties of oil samples recovered in the field are
used to fingerprint their signatures in the satellite imagery. Our
results have proven once again the importance of remote sensing
support for detecting oil spills and the potential use of SAR
imagery to detect floating thick oil.
|
| Title |
Washington Chapter of IEEE/Geoscience and Remote Sensing Society Technical Seminar: NASA's Earth Science Data Systems
Presentation file posted here when available. |
| Speaker |
H.K. 'Rama' Ramapriyan
Assistant Project Manager, Earth Science Data and Information System Project NASA Goddard Space Flight Center |
| Date |
Friday, June 27, 2014
10:00 - 11:30am EST
NCWCP - 5830 University Research Court, in the Conference Center 1604, College Park, MD 20740 |
| Abstract |
One of NASA's three strategic goals is to 'Advance understanding of Earth and develop technologies to improve the quality of life on our home planet.' Earth observation and science are fundamental to achieving this goal. Collecting the data from Earth observing missions, deriving information from them, preserving and providing the data and information to all users are Core components. Core components provide the basic operational capabilities to process, archive, manage and distribute data from NASA missions. Community components provide a path for peer-reviewed research in Earth Science Informatics to feed into the evolution of the core components. The earth Observing System Data and Information System (EOSDIS) is a core component consisting of twelve Distributed Active Archive Centers (DAACs) and eight Science Investigator-led Processing Systems spread across the U.S. EOSDIS manages a growing archive of over 10 Petabytes, with more than 22 Terabytes of data being distributed each day to a diverse user community. The presentation will provide an overview of EOSDIS and its evolution.
|
| Title |
The EUMETSAT Satellite Applications Facility on Land Surface Analysis: Continuous Development and Operations of Remote Sensing Products
Summary Slides, (PDF, 7.69 MB) |
| Speaker |
Dr. Isabel Trigo
EUMETSAT Land SAF Program Manager |
| Date |
Monday, June 9, 2014
1:30pm - 3:00pm EST
NCWCP - Large Conf Room - 2552-2553, 5830 University Research Court, College Park, MD 20740 |
| Abstract |
Isabel F. Trigo received the B.S. and M.S. degrees in Geophysical Sciences from the University of Lisbon in 1993 and 1997, respectively. She received her PhD degree in Climatology in 2000 from the University of East Anglia, UK. Isabel Trigo initiated her research in the area of climate variability, studying synoptic climatology in mid-latitudes. Later she joined the team of the EUMETSAT Satellite Applications Facility on Land Surface Analysis (LSA SAF) at the Portuguese Meteorological Service (now Instituto Portugues do Mar e da Atmosfera, IPMA) to work on retrievals and applications of satellite based Land Surface Temperature. She became the LSA SAF scientific coordinator in 2007 and project manager in 2012.
During the last 15 years, Isabel Trigo has worked on the use of remote sensing data to derive land surface temperature, radiation fluxes, and respective applications focusing in particular EUMETSAT satellites. She has contributed to several European / ESA projects, acting as Project Officer at IPMA; she is currently involved in the implementation of Copernicus Services, the Programme for the establishment of a European capacity for Earth Observation (http://www.copernicus.eu/) at IPMA.
|
| Title |
Building High Quality Climate Data Records from Operational Satellites
Summary Slides, (PDF, 10.69 MB) |
| Speaker |
Fuzhong Weng
NOAA Center for Satellite Applications and Research |
| Date |
Wednesday, March 5, 2014
12:00pm - 01:00pm EST
M-Square Building #950 Room #4102 (Large Conference Room), 5825 University Research Court, College Park, MD 20740 |
| Abstract |
The operational satellites are designed primarily to provide the measurements for short-term weather and environmental predictions. Since the calibrations of most operational instruments in NOAA platforms lack traceability to International Standards (SI) units, sensors and onboard calibration sources degrade in orbit, simply stitching together a series of overlapping satellite observations with orbital drift can introduce many artifacts into the satellite time series. This study presents a series of efforts conducted in our research laboratory to reduce inter-satellite measurement biases and other uncertainties in satellite microwave sounding data sets. The level 1B measurements from MSU, AMSU and ATMS are spatially re-sampled and collocated through simultaneous nadir over-passing (SNO) algorithms. The resulted climate data records at the radiance space after cross calibration display continuity and a reasonable trend. We further investigate how the emission and scattering of clouds and precipitation modulate the brightness temperature trends. It is found that the global mean temperature in the low and middle troposphere has a larger warming rate (about 20-30% higher) when the cloud-affected radiances are removed from AMSU-A data. From the MSU atmospheric temperature profile time series retrieved from 1dvar, it is shown that the atmospheric temperature in the upper troposphere warms up much faster than that in the low troposphere.
|
| Title |
Southern Right Whale mortality at Peninsula Valdés, Argentina - What can satellite data tell us?
|
| Speaker |
Cara Wilson
NOAA/NMFS Environmental Research Division |
| Date |
Wednesday, February 12, 2014
10:00 am - 12:00 pm EST
NCWCP Conference Room 2552, 5830 University Research Court, College Park, MD 20740 |
| Abstract |
The Peninsula Valdés (PV) region of Argentina is an important calving ground for southern right whales (Eubalaena australis). Mothers give birth and raise their calves in its two gulfs, Golfo San José (GSJ) and Golfo Nuevo (GN) annually from May through December and sporadically feed on spring zooplankton patches in September and October. Since 2005 there has been a significant increase in right whale mortality at PV, with most of the deaths (89%) being calves less than 3 months old [Rowntree et al., 2013a]. In 2010 the International Whaling Commission proposed three hypothetical causes to investigate these deaths: (1) a decrease in food abundance (2) biotoxins from harmful algal blooms (HABs) and (3) infectious disease. Here we investigate the biotoxin hypothesis by examining a variety of datasets: the timing of the right whale deaths (1971-2012), abundances of potentially harmful algae Pseudo-nitzchia and Alexandrium tamarense (2000-2012), shellfish closure dates (2004-2012), availability of whale prey at PV (2004, 2005, 2010), biotoxin data in tissue samples from dead whales (2004-2009) and satellite chlorophyll data (1997-2012). Evidence of the whales' exposure to HAB toxins include their presence in the PV region during closures of the shellfish industry due to high STX levels, periods with high levels of Pseudo-nitzchia and Alexandrium tamarense, trace levels of saxitoxin and domoic acid in tissue samples collected from dead whales, and fragments of Pseudo-nitzschia in the feces collected from living at PV. However, no definitive statement can be made about the role of these toxins in the deaths of the whales. In 2004 PV began to experience unusually large chlorophyll blooms in the later part of the calving season, coincident with the rise in whale deaths.
|
| Speaker |
Tim Schmit
NOAA / NESDIS / ASPB |
| Date |
Tuesday, January 28, 2014
1:00 pm - 2:00 pm EST
NCWCP Conference Center, 5830 University Research Court, College Park, MD 20740 |
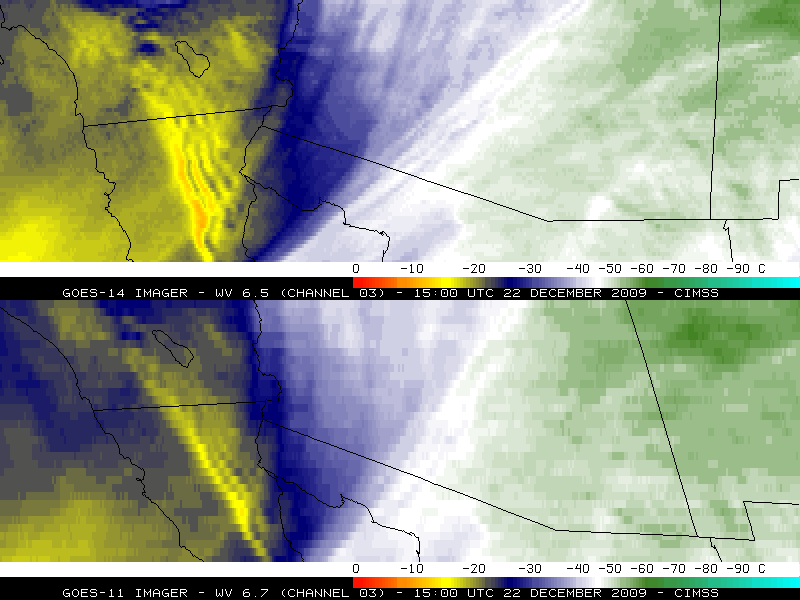
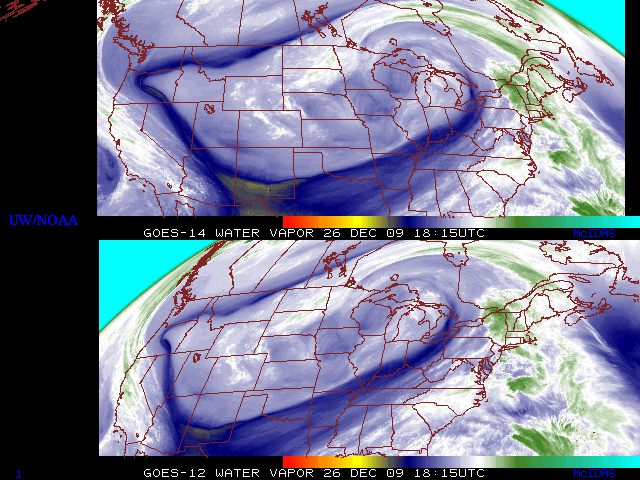
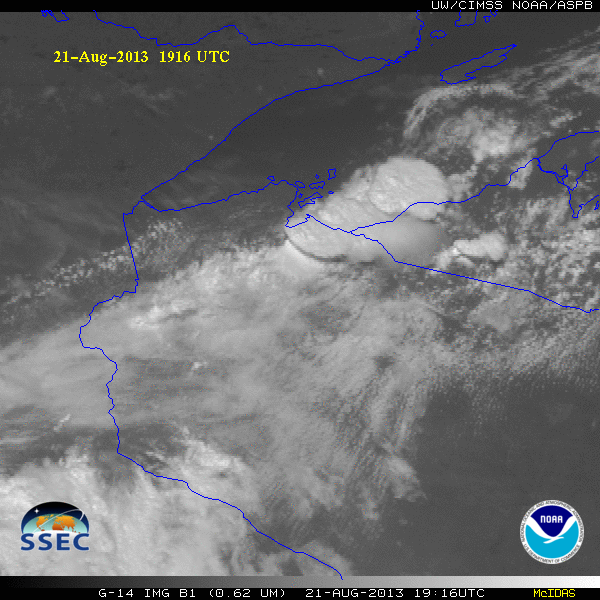
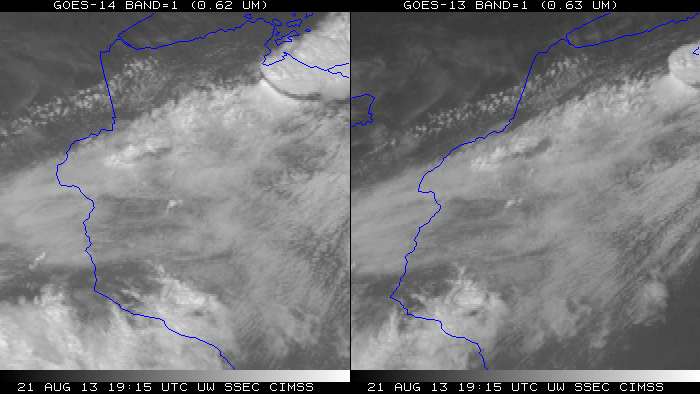
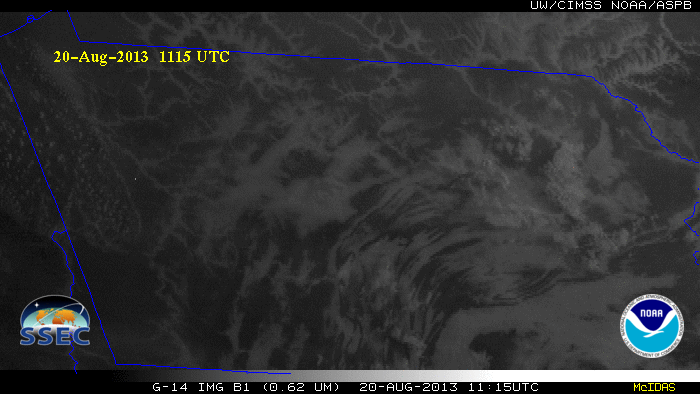
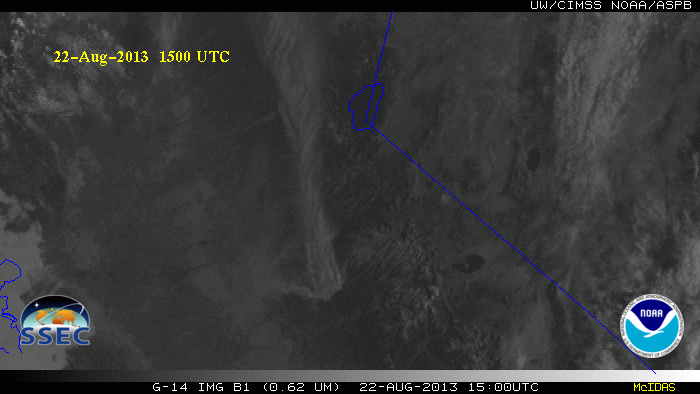
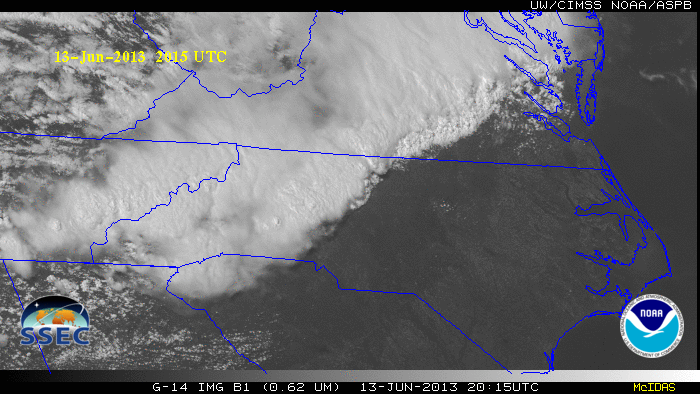
| Title |
Using GOES-14 to Showcase GOES-R ABI Scan Scenarios
Animation files:
- Slide 26 animation, (GIF, 1.93 MB)
- Slide 27 animation, (GIF, 3.01 MB)
- Slide 28 animation, (GIF, 4.29 MB)
- Slide 29 animation, (GIF, 9.05 MB)
- Slide 31 animation, (GIF, 26.33 MB)
- Slide 33 animation, (MOV, 5.82 MB)
- Slide 34 animation, (MOV, 2.24 MB)
- Slide 35 animation, (MOV, 12.6 MB)
- Slide 36 animation, (GIF, 16.74 MB)
- Slide 44 animation, (MPEG, 12.01 MB)
- Slide 46 animation, (MPEG, 9.64 MB)
- Slide 48 animation, (MPEG, 10.57 MB)
- Slide 50 animation, (MPEG, 7.96 MB)
- Slide 54 animation, (MP4, 1.67 MB)
- Slide 55 animation, (GIF, 18.59 MB)
- Slide 76 animation, (GIF, 8.59 MB)
|
| Abstract |
The GOES-14 imager has been operated in a number of special scan
modes. This includes data both during the GOES-14 Post-Launch Test
(PLT) in 2009/10 and data during the summers of 2012 and 2013 when
GOES-14 Imager was operated by NOAA in an experimental super rapid
scan mode to emulate the high temporal resolution sampling of the
Advanced Baseline Imager (ABI) on the next generation GOES-R series.
Imagery with a refresh rate of 1-minute of many phenomena were
acquired during parts of 2012 and 2013, including clouds,
convection, fires, smoke, and hurricanes. NOAA had never before
operated a GOES in nearly continuous 1-minute mode for such an
extended period of time, thereby making this a unique dataset to
explore the future capabilities possible with GOES-R. The ABI will
be able to routinely scan mesoscale (1,000 km x 1,000 km) images
every 30 seconds (or two separate locations every minute). These
high time-resolution images from the GOES-14 Imager are being used
to better prepare for the GOES-R era and its advanced imager.
|
|
