
STAR / SMCD / SPB Solar Backscatter Ultraviolet (SBUV/2) Project - Data Products
Version 8 SBUV Data Quality
A. Profile Screening
The Version 8 (V8) SBUV algorithm applies a number of quality control tests to each profile ozone measurement during processing. The results of these tests are summarized in the profile error flag listed in each compressed data record. An additional measure of data quality is provided by the final residual values for each profile. The final residual at each wavelength represents the difference between the predicted radiance (calculated using the solution ozone profile) and the observed radiance. On this DVD, all final residual values for each profile are combined into a residual quality control parameter (ResQC) that can be used to select data for further analysis, as described in Section B.
B. Data Selection Suggestions
The V8 SBUV profile ozone data records contain flags that can be used to select specific types of data for analysis. This brief description provides suggestions on how to use the profile error flags and residual quality control flags (ResQC) to create the best ozone data set. The profile error flag has three components: the digit in the units place indicates the profile error code, the digit in the tens place indicates an ascending [0] or descending [1] orbit measurement, and the digit in the hundreds place indicates the validation code. Complete descriptions of the profile error code and validation code are given below in Sections C and D, respectively.
- Initial data analysis should only use data with a profile error flag of 0. This selects ascending orbit measurements with the profile error code and validation code equal to 0, and a maximum solar zenith angle of 84 degrees. These data have a maximum ResQC value of 0.20. For any individual instrument, we recommend choosing the lowest ResQC limit that still provides sufficient data coverage in order to maximize overall data set quality. A time history of monthly ResQC flag values for equatorial ozone measurements is shown in Figure 1. Additional coverage during summer months at high latitudes can be obtained by accepting descending orbit measurements (a profile error flag of 10) to ensure that all profiles up to solar zenith angles of 84 degrees are available.
- ResQC values greater than 0.20 may indicate either an instrument measurement error for that scan and/or an atmospheric effect not accounted for by the V8 ozone algorithm. To analyze data with ResQC values greater than 0.2, the user should include measurements with a profile error code of 3 (e.g., profile error flags equal to 3 and 13). An additional filter for specific ResQC limits can be added, based on user analysis requirements. Further information about high ResQC scans and a complete listing of final residue values for all wavelengths is available in the complete level 2 data record.
- Restricting data selection to profile error flags less than 100 (validation codes of 0) will leave gaps in the overall time period represented by the V8 data (November 1978 to December 2003). If a complete time series is desired, the user should also include data with validation codes of 1. This corresponds to selecting profile error flag equal to 100 for ascending orbit measurements (Nimbus-7, NOAA-9 1986-1989, NOAA-11 1988-1995, NOAA-16), and profile error flag equal to 110 for descending orbit measurements (NOAA-9 1993 to 1997, NOAA-11 1997 to 2001).
- Increased coverage at high latitudes can be obtained by including data with a profile error code of 1 (solar zenith angles from 84 to 88 degrees). This corresponds to profile error flags equal to 1 and 101 for ascending orbit data, and profile error flags equal to 11 and 111 for descending orbit data.
- Data selection may be further expanded by including profile error codes of 2, 4, and 5. The user should be aware that these codes generally indicate significant anomalies in the profile retrieval, and analysis results including such data should be evaluated with caution.
- ResQC values are significantly affected by stratospheric aerosols
following major volcanic eruptions (e.g., El ChichÓn in April 1982 and Mt.
Pinatubo in June 1991), and can also show increases due to atmospheric
effects such as sea glint, clouds, and large amounts of aerosols. The
magnitude of the impact on ResQC values will depend on observation
conditions, and is sensitive to the solar zenith angle of the measurement.
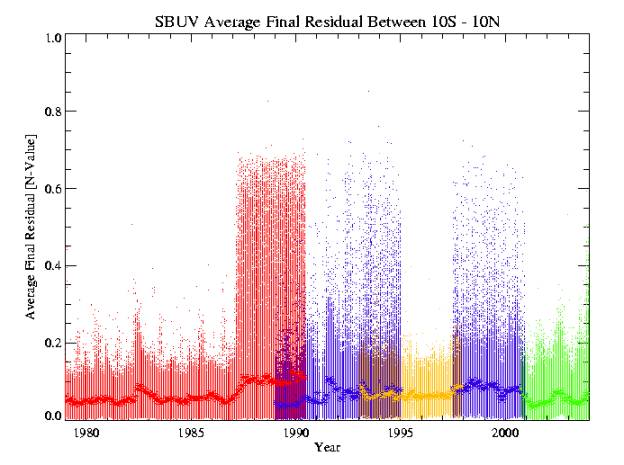
Figure 1. This figure shows a time history of the V8 algorithm final residual quality control (ResQC) values at equatorial latitudes from four different SBUV and SBUV/2 instruments between 1978 and 2003. Dots represent all the data for each month, and asterisks represent monthly averages. Different colors are used to identify each instrument [red for Nimbus-7 SBUV, gold for NOAA-9 SBUV/2 (descending orbit), blue for NOAA-11 SBUV/2, and green for NOAA-16 SBUV/2]. Most individual data values have a magnitude less than 0.2 N-value units. Nimbus-7 SBUV data consistently reach 0.7 N-values during the non-sync period (February 1987 to June 1990). NOAA-11 SBUV/2 has a small population of ResQC data in the range 0.2 to 0.7 N-values during 1992 to 1994 and 1997 to 2000. The NOAA-9 ascending orbit data for 1986 to 1989 are not shown for presentation clarity, but have similar ResQC values to the NOAA-9 descending orbit data.
C. V8 Profile Error Code
This section describes all profile error code values created by the Version 8 algorithm. Please note that only profiles with error codes equal to 0 through 5 are included on this DVD. If more than one value among error codes 2-9 can be applied to a profile, the highest value is used. A summary list is presented first, followed by a more detailed description of each code value.
NOTE: The backscattered radiance measurements of the SBUV(/2) are lowered when the IFOV contains regions undergoing solar eclipses. The V8A incorrectly interprets these low radiances as evidence of increased ozone. We have examined the compressed data to identify these cases by using a solar eclipse database created by NASA GSFC to determine appropriate time periods and latitudes for eclipse occurrences. The retrieval records affected by solar eclipses are given a profile error code of 7. This usage of the profile error code only applies to data on this DVD.
- 0 - Good retrieval.
- 1 - Solar zenith angle > 84 degrees.
- 2 - abs[Step 3 total ozone - Profile total ozone] > 25 D.U.
- 3 - Average abs[final residue] > 0.20 N-value.
- 4 - abs[Final residue] > (3 * instrument error).
- 5 - abs[Retrieved - A Priori] > (3 * a priori error).
- 6 - Non-convergent solution.
- 7 - Upper level profile anomaly - only solar eclipse related for this DVD.
- 8 - Initial residue greater than 18.0 N-value units.
NOAA-17 only: Stray light anomaly (In band stray light). - 9 - Total ozone algorithm failure: first guess not available.
- 10 is added to the error flag value to indicate data taken in descending mode.
- 100 is added to the error flag value to indicate a broad period of lesser quality data (see discussion in Section D).
Definitions
- 0. No problems or anomalies in the profile retrieval.
- 1. The profile retrieval may have increased uncertainty at high SZA. Note that if this flag is set, i.e., the SZA is greater than 84 degrees, then the tests for error codes 2 through 5 are not applied.
- 2. The V8 algorithm calculates total ozone values using two methods: both by performing a TOMS Version 8-type retrieval (Step 3), and by summing all layers in the ozone profile (Profile). If the difference between these results exceeds 25 Dobson units, the profile error code is set to 2.
- 3. The final residue is calculated for each wavelength used in the profile retrieval and expressed in terms of N-value, where Nl = -100log10(Il/Fl). We use the absolute value of each final residue and calculate the average to create the residual quality control flag (ResQC) for each profile. If ResQC is greater than 0.20, the error code is set to 3.
- 4. If the final residue at any wavelength is greater than 3 times the specified instrument error (currently 1.0%), the error code is set to 4.
- 5. If the difference between the retrieved ozone profile and the a priori ozone profile in any layer is greater than 3 times the specified a priori error (currently 50%), the error code is set to 5. This code value is intended to identify anomalous behavior in the lowest profile layers, where SBUV/2 data have very little information content.
- 6. If the profile algorithm fails to converge on a solution after eight iterations, the error code is set to 6.
- 7. If the solution profile above 1 hPa deviates significantly from an exponential altitude dependence, the error code is set to 7.
- 8. For profiles with very large residue values, the error code is set to 8.
NOAA-17 only: Stray light anomaly. - 9. If the total ozone algorithm retrieval is unsuccessful, no profile retrieval is attempted, and the error code is set to 9.
D. Validation Code
The validation code is set to 1 (i.e., a value of 100 is added to the V8 profile error flag) to indicate periods where we have less confidence in the profile ozone data, based on internal validation results. This code frequently represents instrument performance problems. In most cases, the best available correction for the problem has been applied to the data, but residual errors may still be present. The quality of total ozone and the quality of profile ozone data are both affected. Small jumps of 1-2% in total ozone and 5-10% in profile ozone may be observed. Due to the increased noise during such periods, we are unable to identify every perturbed profile with an error flag. Please view unusual profiles during these periods with some skepticism. The validation code is also used to indicate periods where ozone data show greater differences in limited latitude and/or altitude regions, such as the first half of the NOAA-9 data record. The following text gives further descriptions of the periods for which this code has been assigned.
Validation Code Data Periods
D.1. Nimbus-7 SBUV Non-Sync [February 1987 to June 1990]
The Nimbus-7 SBUV chopper wheel began to lose synchronization with the counting electronics on February 13, 1987. Measurements made after this date were characterized by significantly higher noise in each scan. A correction function was developed based on the coherence of coincident 343 nm photometer data, as described by Gleason and McPeters [1995]. This correction decreased monthly average Umkehr layer ozone standard deviation values by 20 to 50%. Nimbus-7 profile ozone data during the "non-sync" period (1987 to 1990) do not show a bias relative to the 1978 to 1986 data. However, anomalous profiles are much more likely to occur during this period, and users should be cautious when examining individual ozone profiles. Approximately 15% of the Nimbus-7 profiles during the non-sync period have ResQC values greater than 0.2. The user may wish to use NOAA- 9 SBUV/2 ascending node data during this period. Please read the discussion of NOAA-9 profile data in Section D.2.
D.2. NOAA-9 SBUV/2 Terminator Crossing [Fall 1990]
The orbit of the NOAA-9 spacecraft drifted significantly during its lifetime, crossing through the terminator (1800/0600 UT Equator-crossing time) in September 1990. NOAA-9 SBUV/2 ozone measurements were made on the ascending node of the orbit (afternoon Equator-crossing time) from February 1985 to September 1990, and on the descending node (morning Equator-crossing time) from September 1990 to February 1998. Comparisons between NOAA-9 zonal average profile ozone and external data sets (sondes, Umkehr measurements) indicate step changes of 5-10% in NOAA-9 ozone values at some latitudes and upper levels between ascending node and descending node data. The NOAA-9 inter-instrument offset was adjusted based on comparisons between NOAA-9 and NOAA-11 in 1993, when both instruments observed scenes at similar solar zenith angles. As a result of this adjustment, NOAA-9 ascending data are offset relative to other data sets. No specific change in instrument performance has been identified as a cause for this result. The NOAA-9 ascending node data for July 1986 to June 1989 are included separately on this DVD to provide an alternate source of ozone profiles during the Nimbus-7 SBUV non-sync period. These NOAA-9 data should not be used in long-term trend analysis unless absolute adjustments are applied. The NOAA-11 satellite orbit also crossed the terminator, but NOAA-11 profile ozone data do not show a step change between March 1995 (end of ascending node measurements) and July 1997 (first descending node measurements).
D.3. SBUV/2 Grating Drive [NOAA-9: October 1993 to February 1998; NOAA-11: September 1993 to March 1995, July 1997 to March 2001]
During the later part of the NOAA-9 and NOAA-11 SBUV/2 operating lifetimes, each instrument's grating drive began to experience wavelength selection problems. Errors up to three grating positions (1 grating position = 0.075 nm) were observed for some channels and time periods. The albedo values have been corrected for the indicated wavelength selection errors using nominal ozone cross-section and solar irradiance spectra. The actual wavelength for a sample may still be in error by up to 0.038 nm because of digitization in the grating drive readout. These wavelength errors produce increased errors in the profile ozone data.
D.4. NOAA-16 SBUV/2 Signal Spikes [March 2002 to December 2003]
The NOAA-16 SBUV/2 instrument experiences periodic negative data fluctuations ("spikes") due to electronic interference from another instrument on the NOAA-16 spacecraft. These spikes are primarily observed at 331.2 nm and 339.8 nm, and lead to erroneous derived surface reflectivity and aerosol index values, which impacts the derived total ozone value. Many of the affected measurements have been identified and assigned a V8 total ozone error flag value of 1. These data represent up to 10% of the NOAA-16 total ozone observations for a single day, beginning in March 2001. The intensity of the problem varies with time, and very few measurements are flagged in some months.
E. Other Data Issues
E.1. Short-Term Effects on ResQC Values
Examination of ResQC values in a restricted latitude band can provide a good indication of the onset and duration of volcanic effects in the V8 data. For example, Nimbus-7 SBUV ResQC values between 17-23°N are affected for approximately six months after the eruption of El ChichÓn in April 1982. The magnitude and duration of volcanic effects also depends on solar zenith angle, which becomes more important for SBUV/2 instruments with drifting orbits. NOAA-11 SBUV/2 ResQC values in the latitude range 3-8°S show significant effects for approximately eight months following the eruption of Mt. Pinatubo in June 1991, with reduced effects continuing into early 1993.
Elevated ResQC values can also be caused by the presence of sea glint, which is observed in Nimbus-7 SBUV data at low latitudes in summer months.
E.2. Nimbus-7 SBUV Hysteresis
The Nimbus-7 SBUV instrument had a problem with the response of its photomultiplier tube (PMT) when emerging from darkness, such that observed Southern Hemisphere radiance values could be up to 8% lower than expected at SZAs of 88 degrees. The magnitude of the error rapidly decreased as the satellite moved northward, and reached zero by SZAs of 50 degrees. A SZA-dependent and time-dependent correction function was developed based on comparisons with concurrent reference photodiode measurements, and has been implemented in V8 ozone processing. Validation results suggest that residual errors of up to 3-4% may still be present at high SH latitudes in the later portion of the Nimbus-7 record. Northern Hemisphere measurements are not affected by this problem.
E.3. NOAA-16 Profile Rejection
Beginning in November 2003, the NOAA-16 SBUV/2 instrument has experienced significant increases in electronic noise at the shortest wavelengths observed (252 nm and 273 nm). Between 10% and 25% of the profile measurements were rejected by the processing system during the periods November 11-23 and December 18-31 due to excessive final residuals at these wavelengths. The remaining data are more likely to have increased noise in the upper portion of the retrieved ozone profile, even when the profile error code is set to 0. Some of these profiles can be identified using the sample program "Neighbor Screen" included on this DVD.
E.4. Data Gaps
The SBUV instruments are designed to provide continuous measurements of the sunlit hemisphere of the Earth. However, instrument and spacecraft problems sometimes interfere with this objective. The following list identifies intervals (Year/Day of Year � Year/Day of Year) where data coverage is limited or unavailable for each instrument on this DVD.
Nimbus-7:
No Northern Hemisphere descending node data due to special
solar measurements.
- 1980/198 - 1980/324
- 1981/183 - 1981/261
- 1984/139 - 1984/204
- 1986/177 - 1986/219
NOAA-9: No data available.
- 1993/213 - 1993/243
- 1995/213 - 1995/258
- 1996/143 - 1996/170
NOAA-9: Limited longitude coverage.
- 1997/189 - 1998/050: 30-80°W at Equator
- 1997 (late August, early September): 100-150°E at Equator also available
NOAA-11: No data available
- 1991/060 - 1991/090
- 1995/091 - 1997/195
F. Sample Program to Screen Data by Comparing Profiles to Nearby Retrievals
The error codes in the data files are determined by using a single set of measurements. The ResQC values are also computed for individual profiles. Comparing the results to nearby values can help to disclose additional anomalous behavior. In particular, the effects of noise spikes in the shortest wavelength channel (273 nm) are difficult to detect for individual retrievals, but by comparing the upper layers to those for adjacent retrievals one can often identify suspect profiles. We give an example of a screening procedure to help to determine if there is a problem with some profiles. Like any screening procedure there is a danger that interesting real profiles may be eliminated along with those produced by unusually noisy measurements. A sample IDL code, which has proven useful in identifying "bad" profiles, is provided. It uses the product of the deviations of the upper stratospheric mixing ratios from those in adjacent retrieval profiles as a measure of unusual behavior. This screen will identify 0.01% of the data as bad during periods of good performance for the lowest noise instruments (NIMBUS-7 prior to 1987 and NOAA-9). For other instruments or during periods of poorer performance it may identify as much as 3% of the data as being of suspect quality due to effects associated with noisy measurements. The screen will sometimes flag profiles as suspect when they are normal but are adjacent to unusual or erroneous profiles.
References
Bhartia, P.K., S. Taylor, R.D. McPeters, and C. Wellemeyer, Application of the Langley plot method to the calibration of the solar backscatter ultraviolet instrument on the Nimbus 7 satellite, J. Geophys. Res., 100, 2997-3004, 1995.
Bhartia, P.K., R.D. McPeters, C.L. Mateer, L.E. Flynn, and C.G. Wellemeyer, Algorithm for the estimation of vertical profiles from the backscattered ultraviolet technique, J. Geophys. Res., 101, 18,793-18,806, 1996.
Frederick, J.E, R. P. Cebula, and D. F. Heath, Instrument characterization for the detection of long-term changes in stratospheric ozone: An analysis of the SBUV/2 radiometer, J. Atmos. Oceanic Technol., 3, 472-480, 1986.
Gleason, J.F, R.D. McPeters, Correction to the Nimbus 7 solar backscatter ultraviolet data in the "nonsync" period (February 1987 to June 1990), J. Geophys. Res., 100, 16,873-16,877, 1995.
Heath, D. F., A. J. Krueger, H. R. Roeder, B. D. Henderson, The solar backscatter ultraviolet and total ozone mapping spectrometer (SBUV/TOMS) for Nimbus G, Optical Engineering, 14, 323-331, 1975.
Heath, D.F., Z. Wei, W.K. Fowler, and V.W. Nelson, Comparison of Spectral Radiance Calibrations of SSBUV-2 Satellite Ozone Monitoring Instruments using Integrating Sphere and Flat-Plate Diffuser Technique, Metrologia, 30, 259-264, 1993.
Hilsenrath, E., R.P. Cebula, M.T. Deland, K. Laamann, S. Taylor, C. Wellemeyer, and P.K. Bhartia, Calibration of the NOAA-11 Solar Backscatter Ultraviolet (SBUV/2) Ozone Data Set from 1989 to 1993 using In-Flight Calibration Data and SSBUV, J. Geophys. Res., 100, 1351-1366, 1995.
Rodgers, C. D., The Characterization and Error Analysis of Profiles Retrieved from Remote Sounding Measurements, J. Geophys. Res., 95, 5587- 5595, 1990.