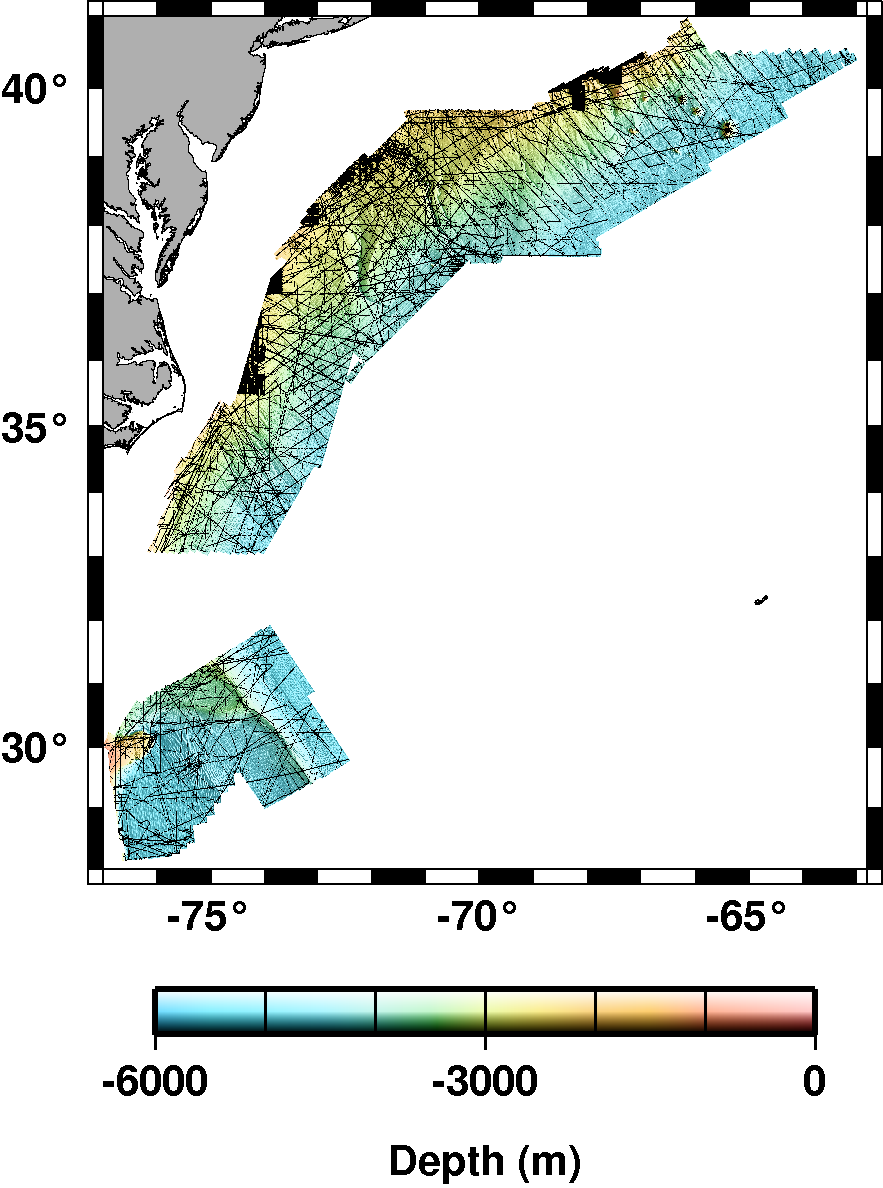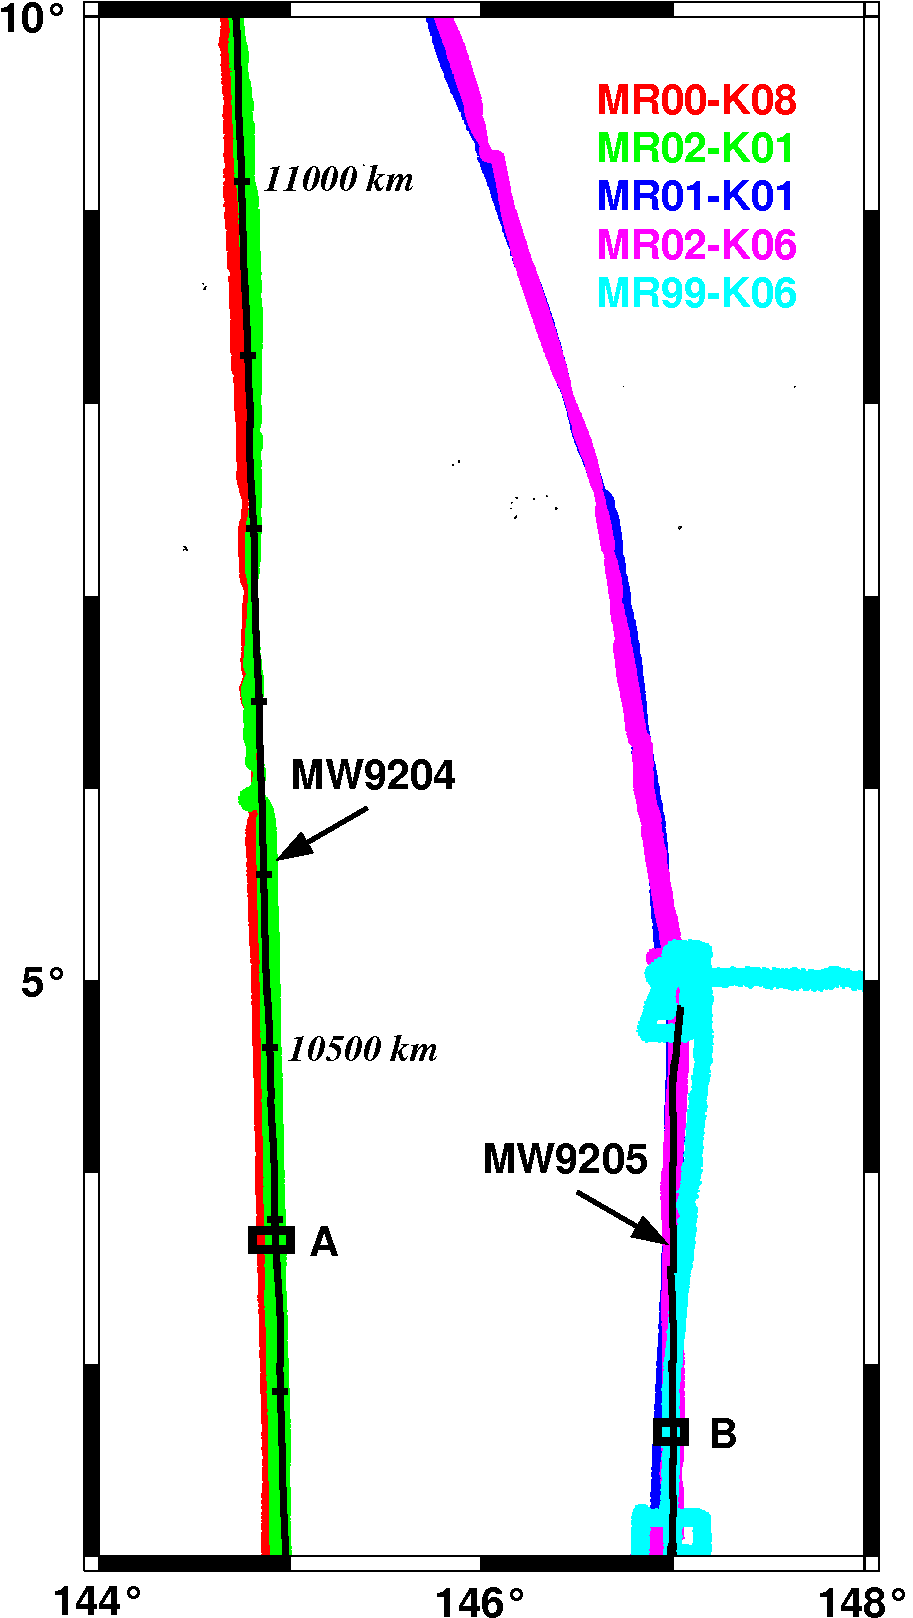
Overlapping multibeam swaths (color) and single beam surveys (black lines)
Altimetric Bathymetry
An uncertainty model for deep ocean single beam and multibeam echo sounder data
Comparing single beam and multibeam echo sounder data where surveys overlap we find that: 95% of multibeam measurements are repeatable to within 0.47% of depth; older single beam data can be at least as accurate as multibeam; single beam and multibeam profiles show excellent agreement at full-wavelengths longer than 4 km; archival sounding errors are not Gaussian; 95% of archival soundings in the northwest Atlantic are accurate to within 1.6% of depth; the 95th percentile error is about five times greater in pre-1969 data than in post-1968 data; many of the largest errors are located over large seafloor slopes, where small navigation errors can lead to large depth errors.
Our uncertainty model has the form σ2 = a2 + (bz)2 + (cs)2, where 2σ is approximately the 95th percentile error, z is the depth, s is the slope, and a, b, c are constants we determine separately for pre-1969 and post-1968 data.
These results are published in:
K. M. Marks and W. H. F. Smith, An uncertainty model for deep ocean single beam and multibeam echo sounder data, Marine Geophysical Researches, 29(4), 239-250, Dec. 2008. Published online: 23 January 2009, DOI: 10.1007/s11001-008-9060-y. Author-produced PDF, (PDF, 637 KB).