
Visualizations
Each topic linked below include images and animations that illustrate
the current state of Arctic ice.
2015 Arctic Sea Ice Maximum Annual Extent Is Lowest On Record - March 2015
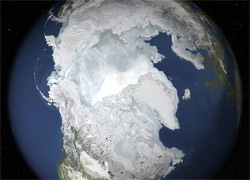 The sea ice cap of
the Arctic appeared to reach its annual maximum winter extent on Feb. 25, according to data from the
NASA-supported National Snow and Ice Data Center (NSIDC) at the University of Colorado, Boulder. At
5.61 million square miles (14.54 million square kilometers), this year's maximum extent was the smallest
on the satellite record and also one of the earliest. The sea ice cap of
the Arctic appeared to reach its annual maximum winter extent on Feb. 25, according to data from the
NASA-supported National Snow and Ice Data Center (NSIDC) at the University of Colorado, Boulder. At
5.61 million square miles (14.54 million square kilometers), this year's maximum extent was the smallest
on the satellite record and also one of the earliest.
NASA Study Shows Global Sea Ice Diminishing, Despite Antarctic Gains - February 2015
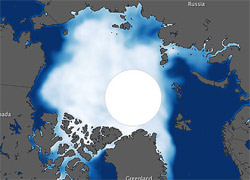 Sea ice
increases in Antarctica do not make up for the accelerated Arctic sea ice
loss of the last decades, a new NASA study finds. As a whole, the planet
has been shedding sea ice at an average annual rate of 13,500 square miles
(35,000 square kilometers) since 1979, the equivalent of losing an area of
sea ice larger than the state of Maryland every year. Sea ice
increases in Antarctica do not make up for the accelerated Arctic sea ice
loss of the last decades, a new NASA study finds. As a whole, the planet
has been shedding sea ice at an average annual rate of 13,500 square miles
(35,000 square kilometers) since 1979, the equivalent of losing an area of
sea ice larger than the state of Maryland every year.
Old ice in Arctic vanishingly rare - January 2015
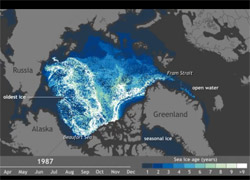 Since the
1980s, the amount of perennial ice in the Arctic has declined. This
animation tracks the relative amount of ice of different ages from 1987
through early November 2014. The oldest ice is white; the youngest
(seasonal) ice is dark blue. Key patterns are the export of ice from the
Arctic through Fram Strait and the melting of old ice as it passes through
the warm waters of the Beaufort Sea. Since the
1980s, the amount of perennial ice in the Arctic has declined. This
animation tracks the relative amount of ice of different ages from 1987
through early November 2014. The oldest ice is white; the youngest
(seasonal) ice is dark blue. Key patterns are the export of ice from the
Arctic through Fram Strait and the melting of old ice as it passes through
the warm waters of the Beaufort Sea.
Arctic Sea Ice - On the Decline - December 2014
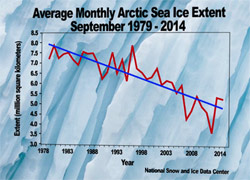 This video from NOAA's Ocean Today site discusses how
arctic sea ice reached its maximum extent for the year on March 21 at 14.8 million square
kilometers (5.70 million square miles), making it the fifth lowest maximum in the satellite record. This video from NOAA's Ocean Today site discusses how
arctic sea ice reached its maximum extent for the year on March 21 at 14.8 million square
kilometers (5.70 million square miles), making it the fifth lowest maximum in the satellite record.
2014 Arctic Report Card: Visual Highlights - December 2014
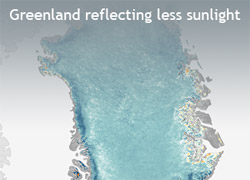 The latest
installment of NOAA's Arctic Report Card confirms
that Arctic air temperatures are rising at more than twice the rate of the
planet as a whole. The amount of ice that survives the summer melt season
is shrinking, and water temperatures are rising. Some polar bear
populations are declining. The number of snow days is falling. The
Greenland Ice Sheet is becoming less able to reflect incoming sunlight. The latest
installment of NOAA's Arctic Report Card confirms
that Arctic air temperatures are rising at more than twice the rate of the
planet as a whole. The amount of ice that survives the summer melt season
is shrinking, and water temperatures are rising. Some polar bear
populations are declining. The number of snow days is falling. The
Greenland Ice Sheet is becoming less able to reflect incoming sunlight.
Arctic Sea Ice Minimum for 2014 - September 2014
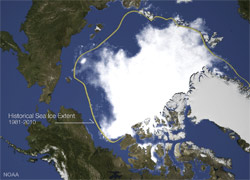 According to analysis by the National Snow and Ice Data Center,
sea ice in the Arctic reached its annual minimum on September 17, 2014. At
5.02 million square kilometers or 1.94 million square miles, this was the
sixth lowest amount of ice on record since satellite observations began in
1979. This image, using microwave data from the SSMIS sensor on the DMSP
satellites, shows the sea ice concentration on September 17, 2014, along
with a yellow line indicating the median sea ice extent for 1981-2010. According to analysis by the National Snow and Ice Data Center,
sea ice in the Arctic reached its annual minimum on September 17, 2014. At
5.02 million square kilometers or 1.94 million square miles, this was the
sixth lowest amount of ice on record since satellite observations began in
1979. This image, using microwave data from the SSMIS sensor on the DMSP
satellites, shows the sea ice concentration on September 17, 2014, along
with a yellow line indicating the median sea ice extent for 1981-2010.
Glacial Runoff Plume in the Gulf of Alaska - August 2013
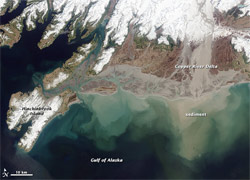 Named for the ore
deposits found upstream, the Copper River drains an area of more than
24,000 square miles and flows into the Gulf of
Alaska. By volume of discharge, it is the tenth largest river in the
United States. Its delta forms one of the largest and most productive
wetlands on the Pacific Coast of North America. "The glaciers in this area
are receding at some of the fastest rates in the world, which can have all
kinds of impacts on the local ecosystems," said Robert Campbell, research
oceanographer at the Prince William Sound Science Center. Scientists are
trying to figure out what exactly these impacts
will be in the Copper River watershed. Named for the ore
deposits found upstream, the Copper River drains an area of more than
24,000 square miles and flows into the Gulf of
Alaska. By volume of discharge, it is the tenth largest river in the
United States. Its delta forms one of the largest and most productive
wetlands on the Pacific Coast of North America. "The glaciers in this area
are receding at some of the fastest rates in the world, which can have all
kinds of impacts on the local ecosystems," said Robert Campbell, research
oceanographer at the Prince William Sound Science Center. Scientists are
trying to figure out what exactly these impacts
will be in the Copper River watershed.
2015 Symposium Information
Symposium Hosts
Additional information:
Dr. Pablo Clemente-Colón
Chief Scientist, National Ice Center
|


 According to analysis by the National Snow and Ice Data Center,
sea ice in the Arctic reached its annual minimum on September 17, 2014. At
5.02 million square kilometers or 1.94 million square miles, this was the
sixth lowest amount of ice on record since satellite observations began in
1979. This image, using microwave data from the SSMIS sensor on the DMSP
satellites, shows the sea ice concentration on September 17, 2014, along
with a yellow line indicating the median sea ice extent for 1981-2010.


