
NOAA Satellites See Hurricane FlorenceGOES View of FlorenceGOES TrueColor video of Florence was created at 16 frames per second using 1-minute mesoscale data showing Florence's approach to the east coast. The animation is made from images captured from the GOES East imagery site. The GOES site logged peak traffic of over a million visits and 30 million image downloads on Sept. 13. See more GOES Images. 3D Animation of Temperature Anomalies in Florence from NOAA-20 ATMS and VIIRS
NOAA Joint Polar Satellite System (JPSS) satellites provide unprecedented high resolution observations of the three dimensional structure of Florence. Using the vertical temperature profiles derived from the Advanced Technology Microwave Sounder (ATMS) and the visible image from the Visible Infrared Imaging Radiometer Suite (VIIRS), this animation of the Hurricane Florence on September 9th captured the temperature differences between the outer and the inner portions of the hurricane, known as the upper-level warm core structure. The formation of such upper-level warm core is believed to be very important for the rapid intensification of tropical cyclones. A series of such animations are produced at NOAA JPSS spanning each day as the hurricane develops to facilitate the hurricane forecast and strategic planning, as well as scientific investigations into hurricane intensification and trajectory prediction. Thanks to the ICVS team for developing this animation. S-NPP and NOAA-20 Infrared Observations Combined to see Florence
Using the JPSS Program's new JSTAR Mapper website, screen captures of SNPP and NOAA-20's VIIRS I5 band were composited to show the storm's evolution between September 6, 2018 and September 10, 2018.
Tracking Cyclones with CrIS
CrIS observations are able to track the location of tropical cyclones by sensing the cold cloud top temperatures associated to the deep convection developed over the tropical cyclones. CrIS observations also help to identify different development stages: deep organized convection around hurricane Florence; convection around tropical storm Isaac becoming disorganized between Sep 11 and 13; formation of the tropical storm Joyce on Sep 12 from a low pressure system in the north Atlantic; Helene evolving toward a weaker and disorganized convective pattern on Sep 13. Thanks to the CrIS SDR team for these animations. TPW Seen from Multiple Polar Satellites
As Florence moved across the Atlantic, animation combining images from GCOM, S-NPP, NOAA-20, and MetOp-B depict the total precipitable water of the storm from August 30 through September 12. Total precipitable water (TPW) is the depth of water in a column of the atmosphere, if all the water in that column were precipitated as rain, and is measured in millimeters or inches. Thanks to the MIRS team for this animation. Windspeed via SAR & NRCS Images from Sentinel 1B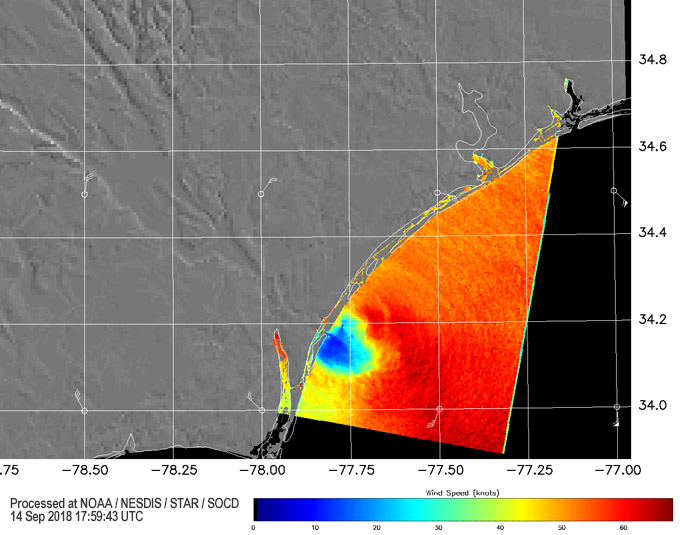
SAR Winds at Florence's Landfall
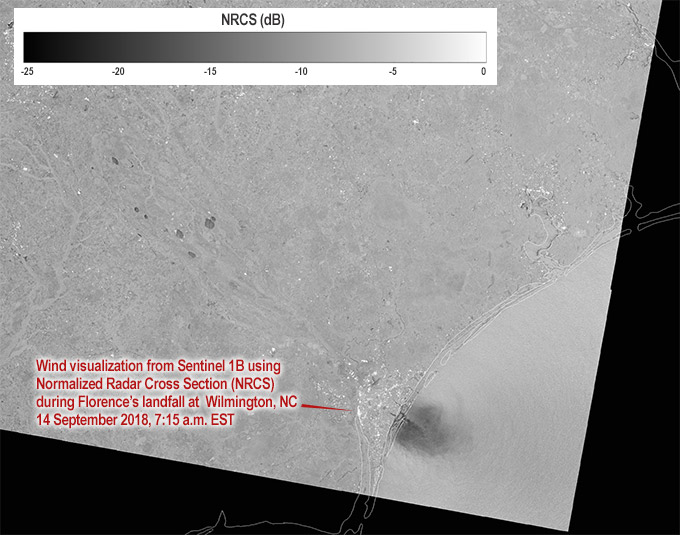
NRCS Winds at Florence's Landfall
Images from Sentinel 1B showing wind speed via Synthetic Aperture Radar (SAR) and normalized radar cross section (NRCS). NRCS is the measure of how much radar energy is reflected back from a target. Synthetic Aperture Radar measures windspeed by detecting surface roughness on bodies of water; the rougher the surface the more radar energy reflected, and hence a higher NRCS of the reflecting target. As a method of detecting windspeed, SAR only works over the water because the water is roughened by the wind and the radar is sensitive to the centimeter scale roughness induced by the wind. |