
STAR / SMCD / EMB Aerosol Remote Sensing
Analysis of AVHRR Aerosol Data
 Aerosol optical depth (AOD) were
retrieved from the nearly 25-year record of inter-calibrated radiances in
the AVHRR Pathfinder
Atmosphere-Extended (PATMOS-x) data set. The PATMOS-x
radiance dataset was recalibrated using MODIS radiances [Heidinger et al., 2002]. The
aerosol algorithm used to retrieve AOD was the independent two-channel
algorithm also employed in the operational processing. A description of
the algorithm is accessible from the Products/AVHRR page.
Aerosol optical depth (AOD) were
retrieved from the nearly 25-year record of inter-calibrated radiances in
the AVHRR Pathfinder
Atmosphere-Extended (PATMOS-x) data set. The PATMOS-x
radiance dataset was recalibrated using MODIS radiances [Heidinger et al., 2002]. The
aerosol algorithm used to retrieve AOD was the independent two-channel
algorithm also employed in the operational processing. A description of
the algorithm is accessible from the Products/AVHRR page.
 The long-term trend of AOD over
the global oceans has been studied from the PATMOS-x aerosol record.
A linear decadal change of -0.01 is obtained for globally and
monthly averaged AOD. This negative tendency is even more
evident in globally and annually averaged AOD; the magnitude can be up to
-0.03/decade. The decreasing trend is consistent with that found from
the GACP
data. Seasonal patterns in the AOD regional long-term trend
are also evident. In general, negative tendencies are observed for
seasonally averaged AOD in the regions influenced by emissions from
industrialized countries and the magnitude can be up to -0.10/decade.
Positive tendencies are observed in regions influenced by emissions
from fast developing countries; their magnitude can be up to as large
as +0.04/decade. For regions heavily influenced by Saharan desert
particles, a negative trend with a maximum magnitude of -0.03/decade is
detected. However, over regions influenced by smoke from biomass
burning, positive tendencies with a maximum magnitude of +0.04/decade
are found [Zhao et
al., 2008].
The long-term trend of AOD over
the global oceans has been studied from the PATMOS-x aerosol record.
A linear decadal change of -0.01 is obtained for globally and
monthly averaged AOD. This negative tendency is even more
evident in globally and annually averaged AOD; the magnitude can be up to
-0.03/decade. The decreasing trend is consistent with that found from
the GACP
data. Seasonal patterns in the AOD regional long-term trend
are also evident. In general, negative tendencies are observed for
seasonally averaged AOD in the regions influenced by emissions from
industrialized countries and the magnitude can be up to -0.10/decade.
Positive tendencies are observed in regions influenced by emissions
from fast developing countries; their magnitude can be up to as large
as +0.04/decade. For regions heavily influenced by Saharan desert
particles, a negative trend with a maximum magnitude of -0.03/decade is
detected. However, over regions influenced by smoke from biomass
burning, positive tendencies with a maximum magnitude of +0.04/decade
are found [Zhao et
al., 2008].
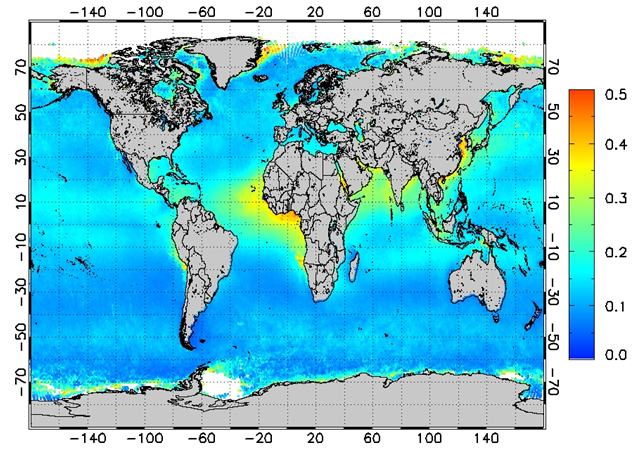
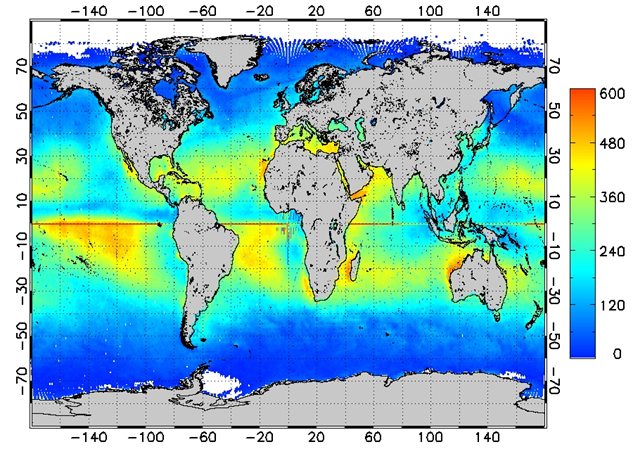
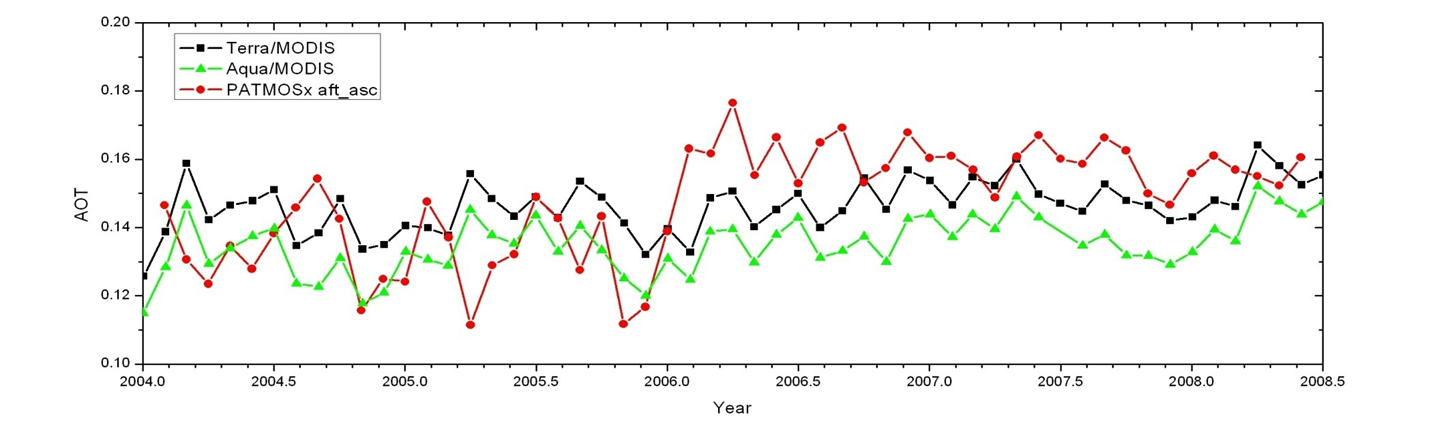
The mean of monthly-average aerosol optical depths for the period of Apr 2004 -May 2008 is shown in Figure 1, along with the total number of samples available for calculating the mean. Monthly mean AOD values in PATMOS-x were also compared to those available in the standard MODIS aerosol products. The time series of monthly AOD from PATMOS-x and from MODIS/Terra and MODIS/Aqua is shown in Figure 2.
 |
 |
 |
References:
Heidinger, A. K., C. Cao, and J. Sullivan (2002), Using Moderate Resolution Imaging Spectrometer (MODIS) to calibrate Advanced Very High Resolution Radiometer (AVHRR) reflectance channels, J. Geophys. Res., 107(D23), 4702, doi:10.1029/2001JD002035.
Zhao X.P, I. Laszlo, W. Guo, A. Heidinger, C. Cao, A. Jelenak, D. Tarpley, and J. Sullivan, (2008), Study of long-term trend in aerosol optical thickness observed from operational AVHRR satellite instrument, J. Geophys. Res., 113, D07201, doi:10.1029/2007JD009061.