
STAR / SMCD / EMB Aerosol Remote Sensing
Single- and multi-channel algorithms
 Comparisons of the single- and
multi-channel, aerosol products reported in the Clouds
and the Earth's Radiant Energy System (CERES) datasets showed
systematic differences that were partly attributed to differences in
sampling and cloud screening. A study was conducted that tried quantifying
the aerosol optical depth (AOD)
differences when the above differences were absent and exactly the same
clear radiances were inputted to the aerosol algorithms used to generate
the two products. This was accomplished by retrieving AOD with the single-
channel algorithm at 22 oceanic locations from the reflectance data in the
MODIS Atmosphere Parameters
Subset Statistics (MAPSS) dataset for the period of 2000-2007, and
then by comparing them to the corresponding MODIS AOD data reported in
MAPSS. On average, the mean differences were wavelength and platform
dependent (Figure 1). The single-channel 644-nm average AOD was larger by
0.004-0.015 (~2-9%) than that from the multi-channel algorithm. The mean
AOD at 1632 nm from both algorithms were very similar from Terra, but the
single-channel AOD from Aqua at 2119 nm was lower by 0.02 (~24%).
Slight dependence of the mean differences on the scattering angle was
observed, which was partially explained by the differences between the
retrieved aerosol model in the multi-channel retrieval, and the fixed
aerosol model used in the single-channel algorithm [Laszlo et al., 2008].
Comparisons of the single- and
multi-channel, aerosol products reported in the Clouds
and the Earth's Radiant Energy System (CERES) datasets showed
systematic differences that were partly attributed to differences in
sampling and cloud screening. A study was conducted that tried quantifying
the aerosol optical depth (AOD)
differences when the above differences were absent and exactly the same
clear radiances were inputted to the aerosol algorithms used to generate
the two products. This was accomplished by retrieving AOD with the single-
channel algorithm at 22 oceanic locations from the reflectance data in the
MODIS Atmosphere Parameters
Subset Statistics (MAPSS) dataset for the period of 2000-2007, and
then by comparing them to the corresponding MODIS AOD data reported in
MAPSS. On average, the mean differences were wavelength and platform
dependent (Figure 1). The single-channel 644-nm average AOD was larger by
0.004-0.015 (~2-9%) than that from the multi-channel algorithm. The mean
AOD at 1632 nm from both algorithms were very similar from Terra, but the
single-channel AOD from Aqua at 2119 nm was lower by 0.02 (~24%).
Slight dependence of the mean differences on the scattering angle was
observed, which was partially explained by the differences between the
retrieved aerosol model in the multi-channel retrieval, and the fixed
aerosol model used in the single-channel algorithm [Laszlo et al., 2008].
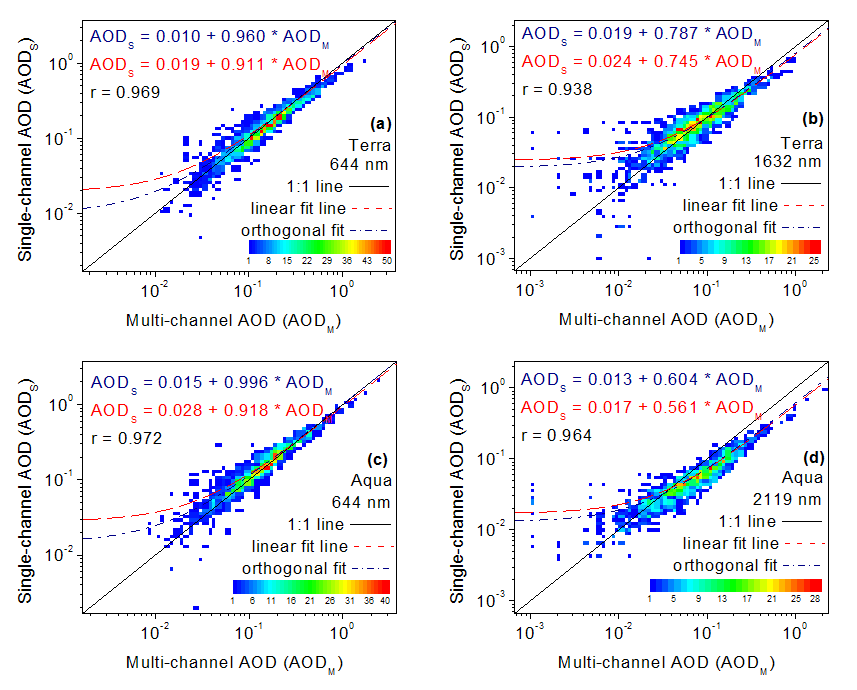 |
Note that although the results are plotted in log-log scale, the regression analyses and corresponding statistics were calculated in the linear scale. AODS was retrieved from the 10-km central pixel reflectance in MAPSS, while AODM was obtained directly from MAPSS for the corresponding pixel. The correlation coefficient (r), the 1:1 line, and the line and coefficients of the standard and orthogonal linear fits are also shown. The scale represents the number of AOD values. |
|---|