
Ocean Topography and Cryosphere Branch / Laboratory for Satellite Altimetry / Sea Level Rise
Products / Sea level rise maps
The following maps provide estimates of sea level rise based on measurements from satellite radar altimeters. The local trends were estiamted using data from TOPEX/Poseidon (T/P), Jason-1, Jason-2, and Jason-3, which have monitored the same ground track since 1992.
An inverted barometer has been applied. The estimates of sea level rise do not include glacial isostatic adjustment effects on the geoid, which are modeled to be +0.2 to +0.5 mm/year when globally averaged.
| Map of sea level rise from TOPEX and Jason-1,-2,-3 | |
|---|---|
| Download local sea level trends as a COADS-compliant NetCDF file (445 kB). Download local sea level trends as an ASCII file (6 mB). | |
| Color table: sst A 613 kB pdf opens in a new window.  A 336 kB png opens in a new window. 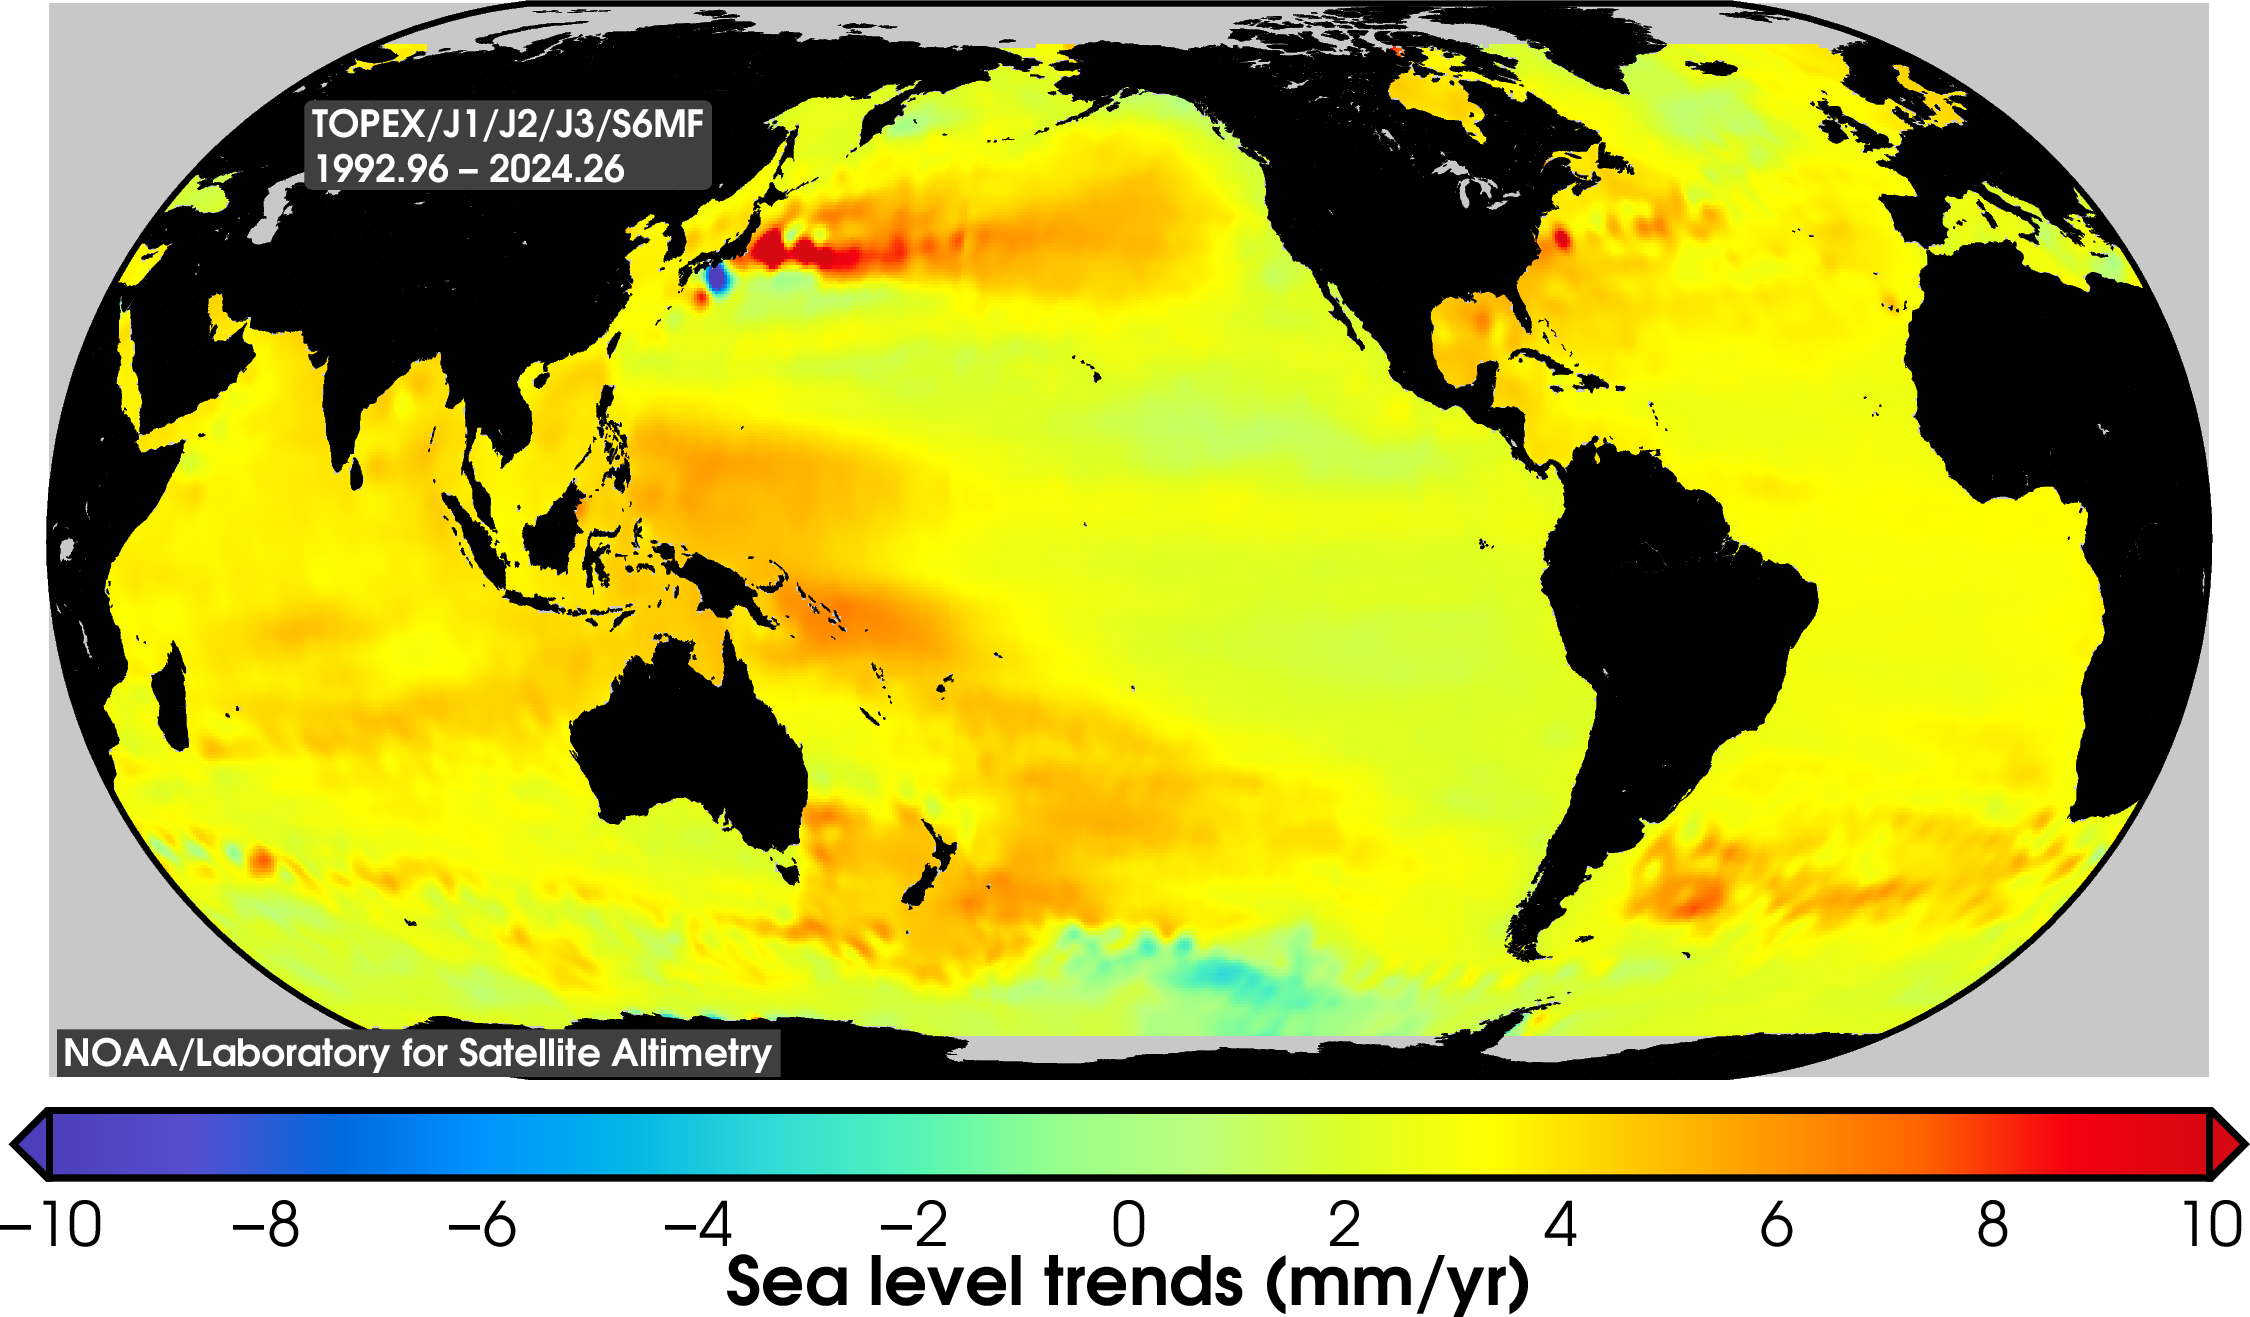  |
Color table: blue2red A 497 kB pdf opens in a new window. A 176 kB png opens in a new window. 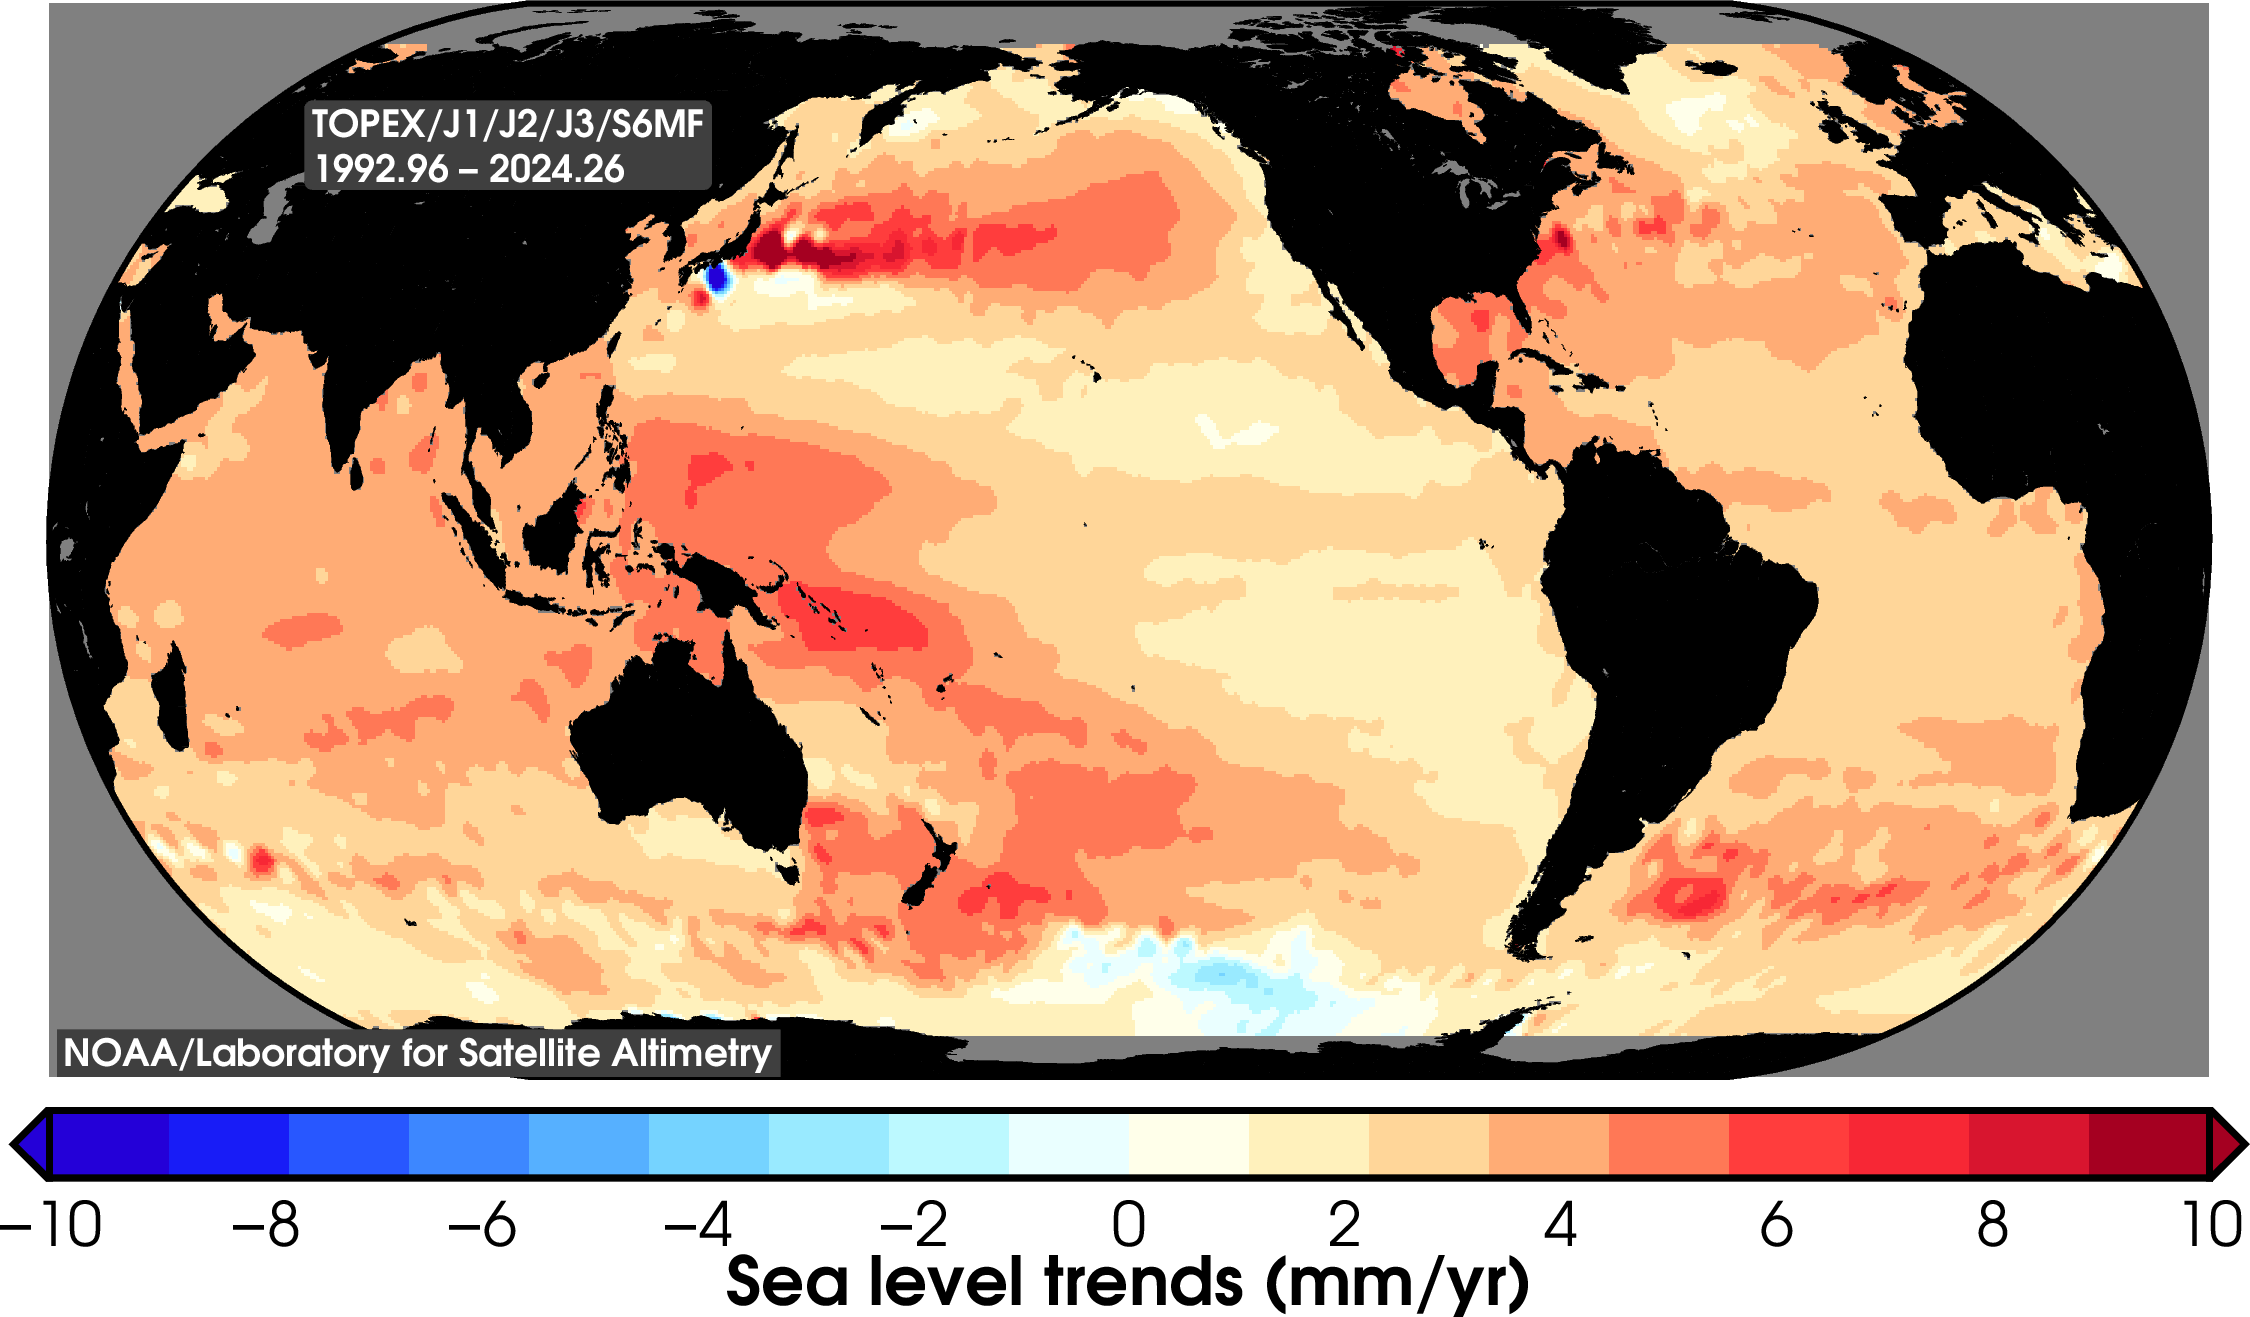  |
| Color table: spectrum A 595 kB pdf opens in a new window. A 299 kB png opens in a new window. 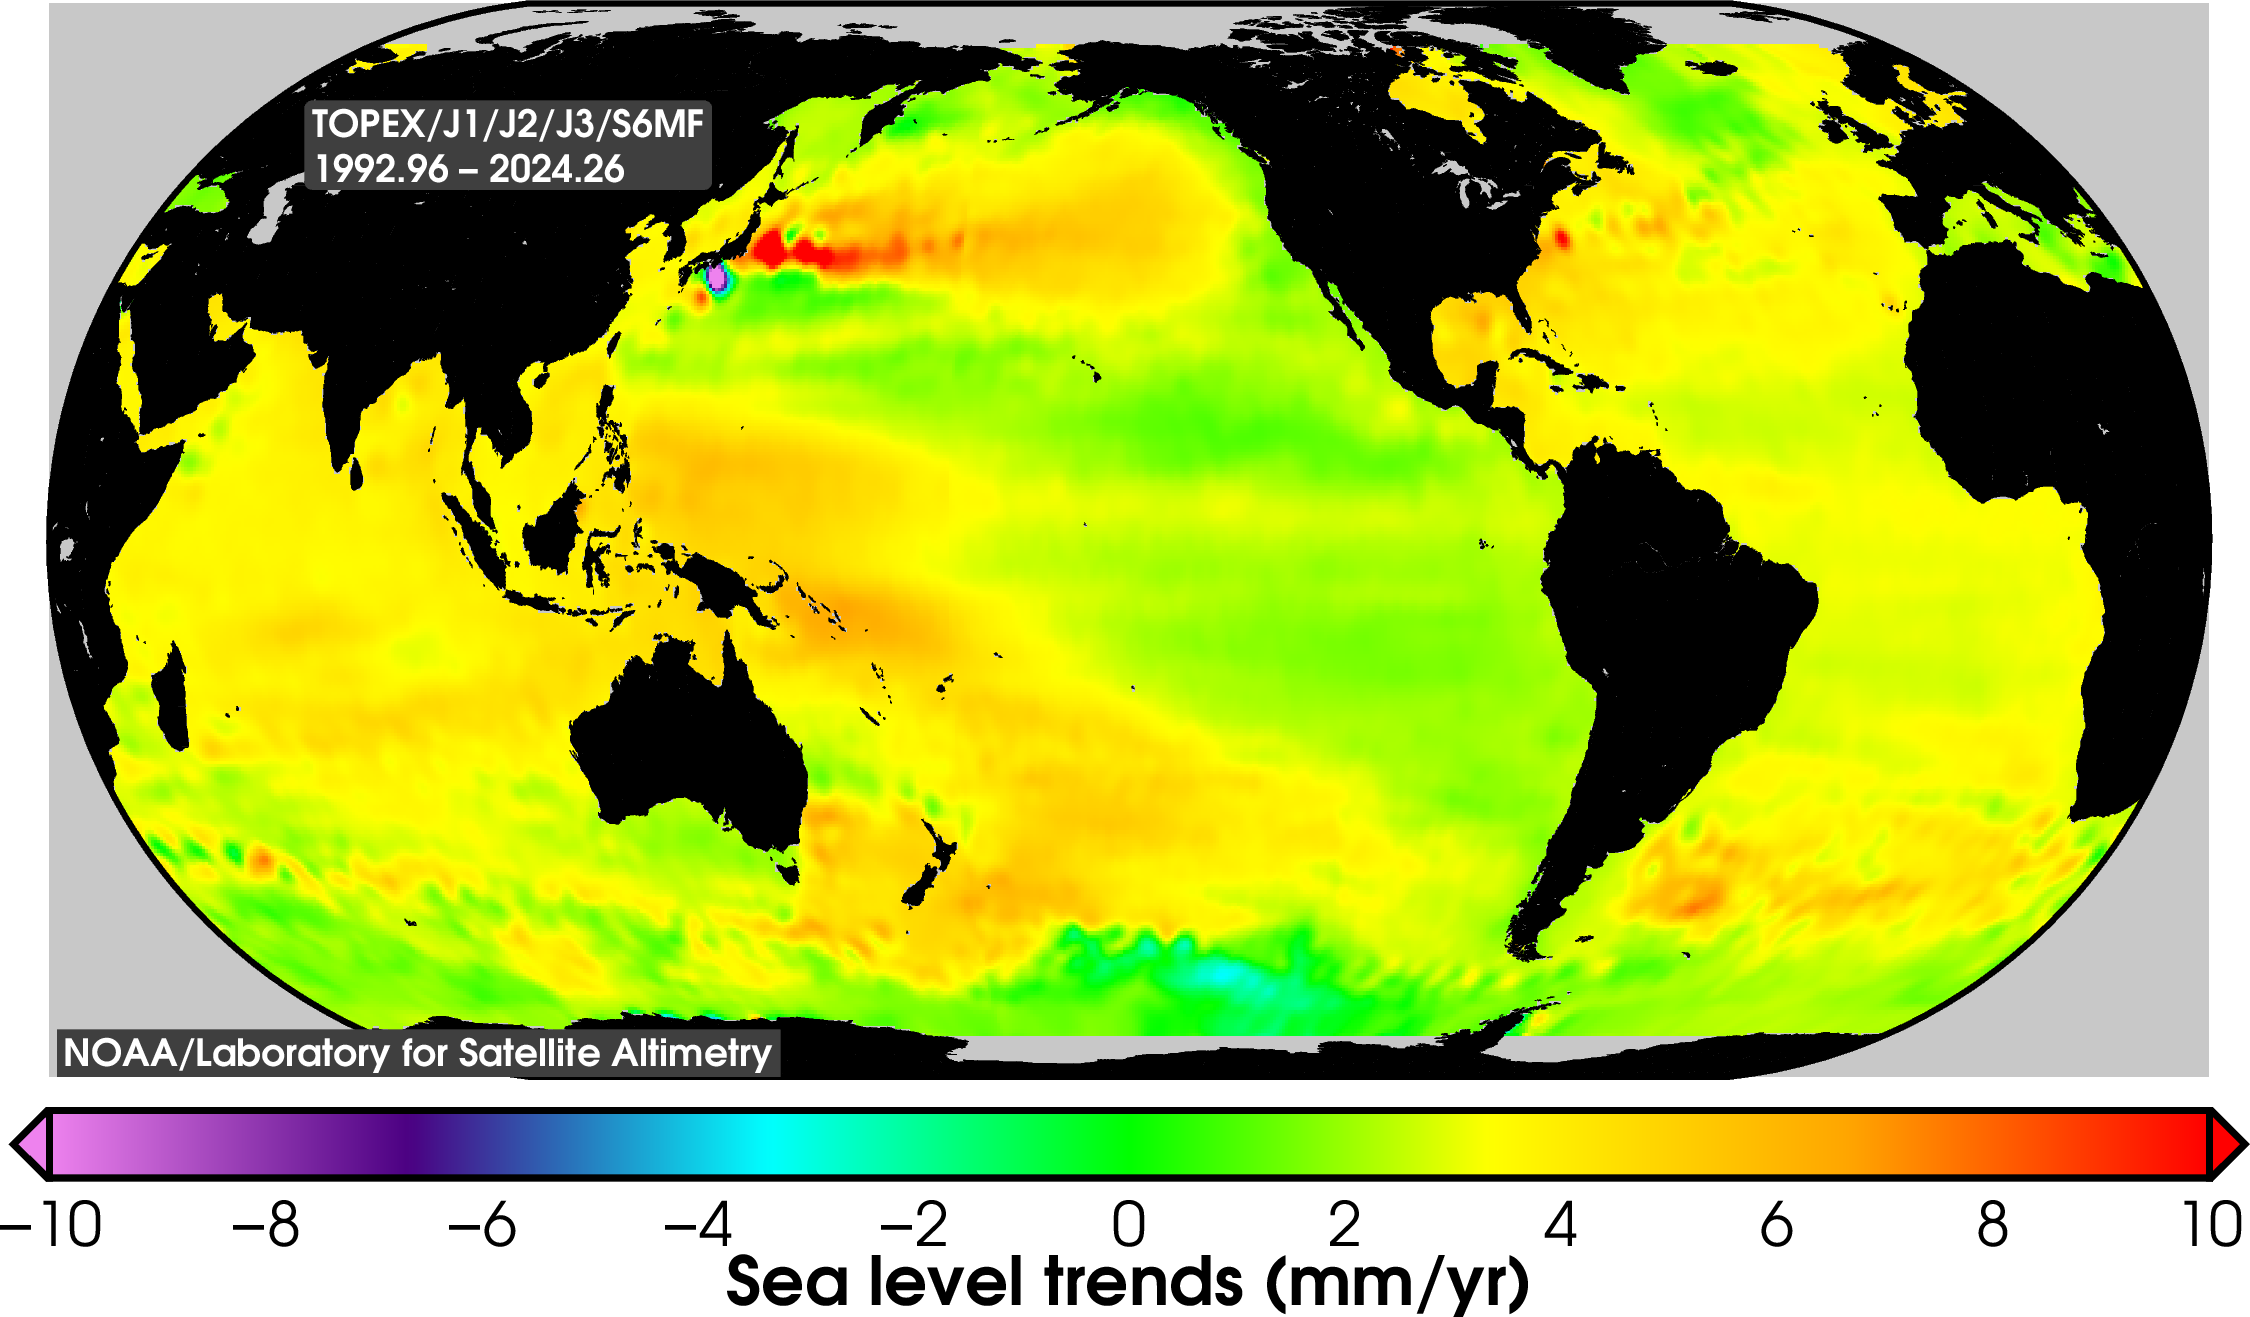  |
Color table: wysiwyg A 595 kB pdf opens in a new window. A 303 kB png opens in a new window. 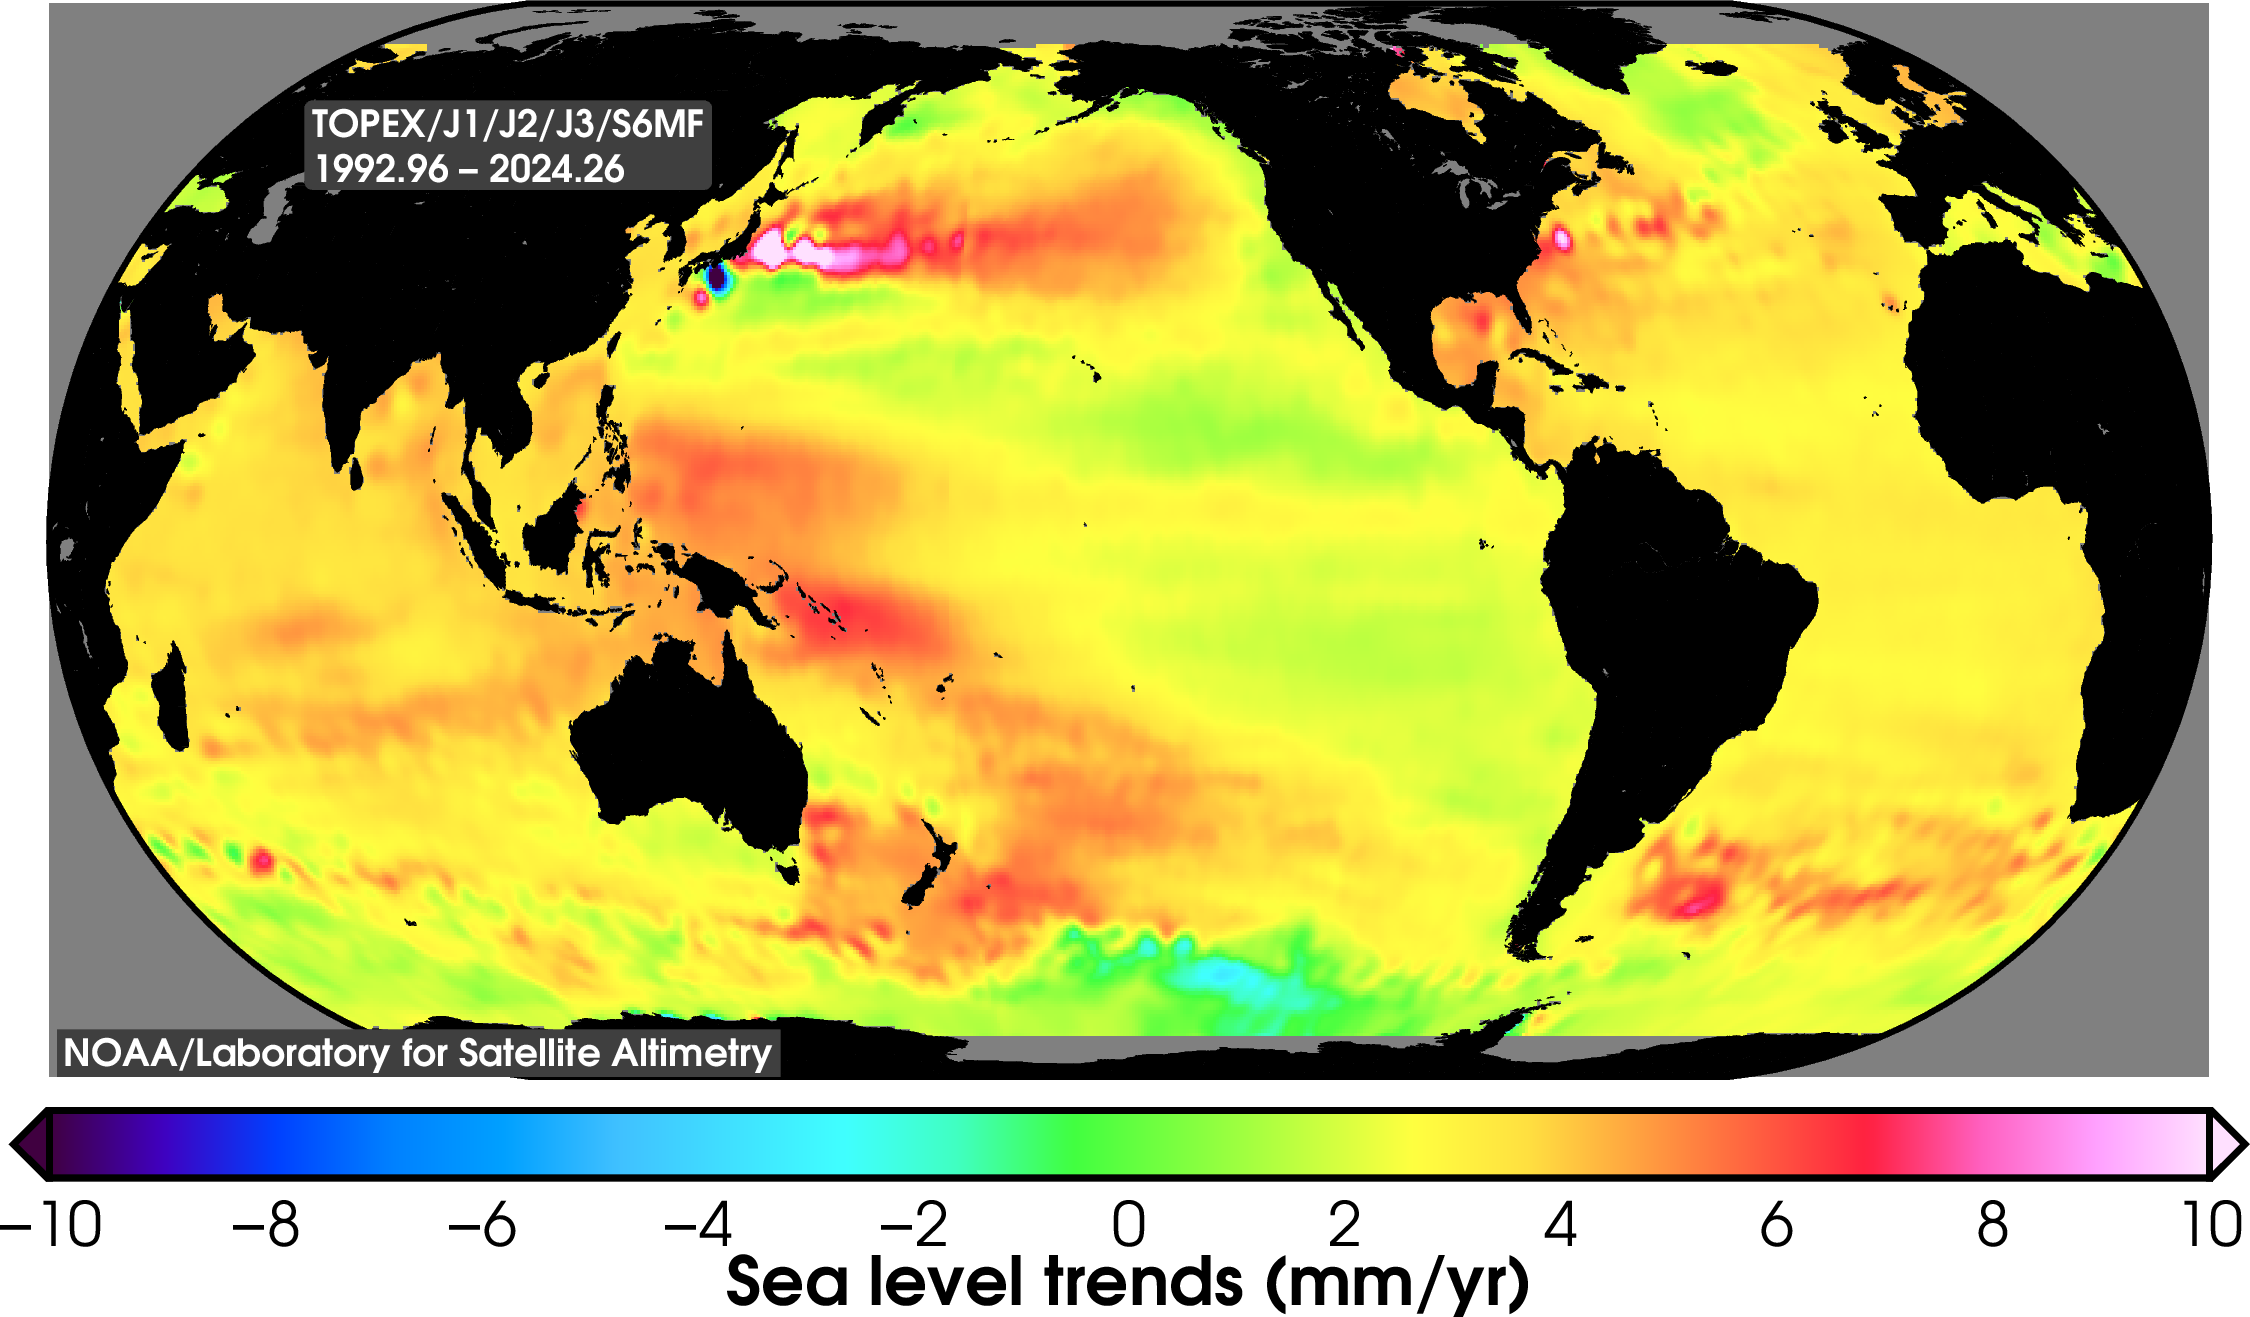  |
| Color table: blue2orange A 495 kB pdf opens in a new window. A 158 kB png opens in a new window. 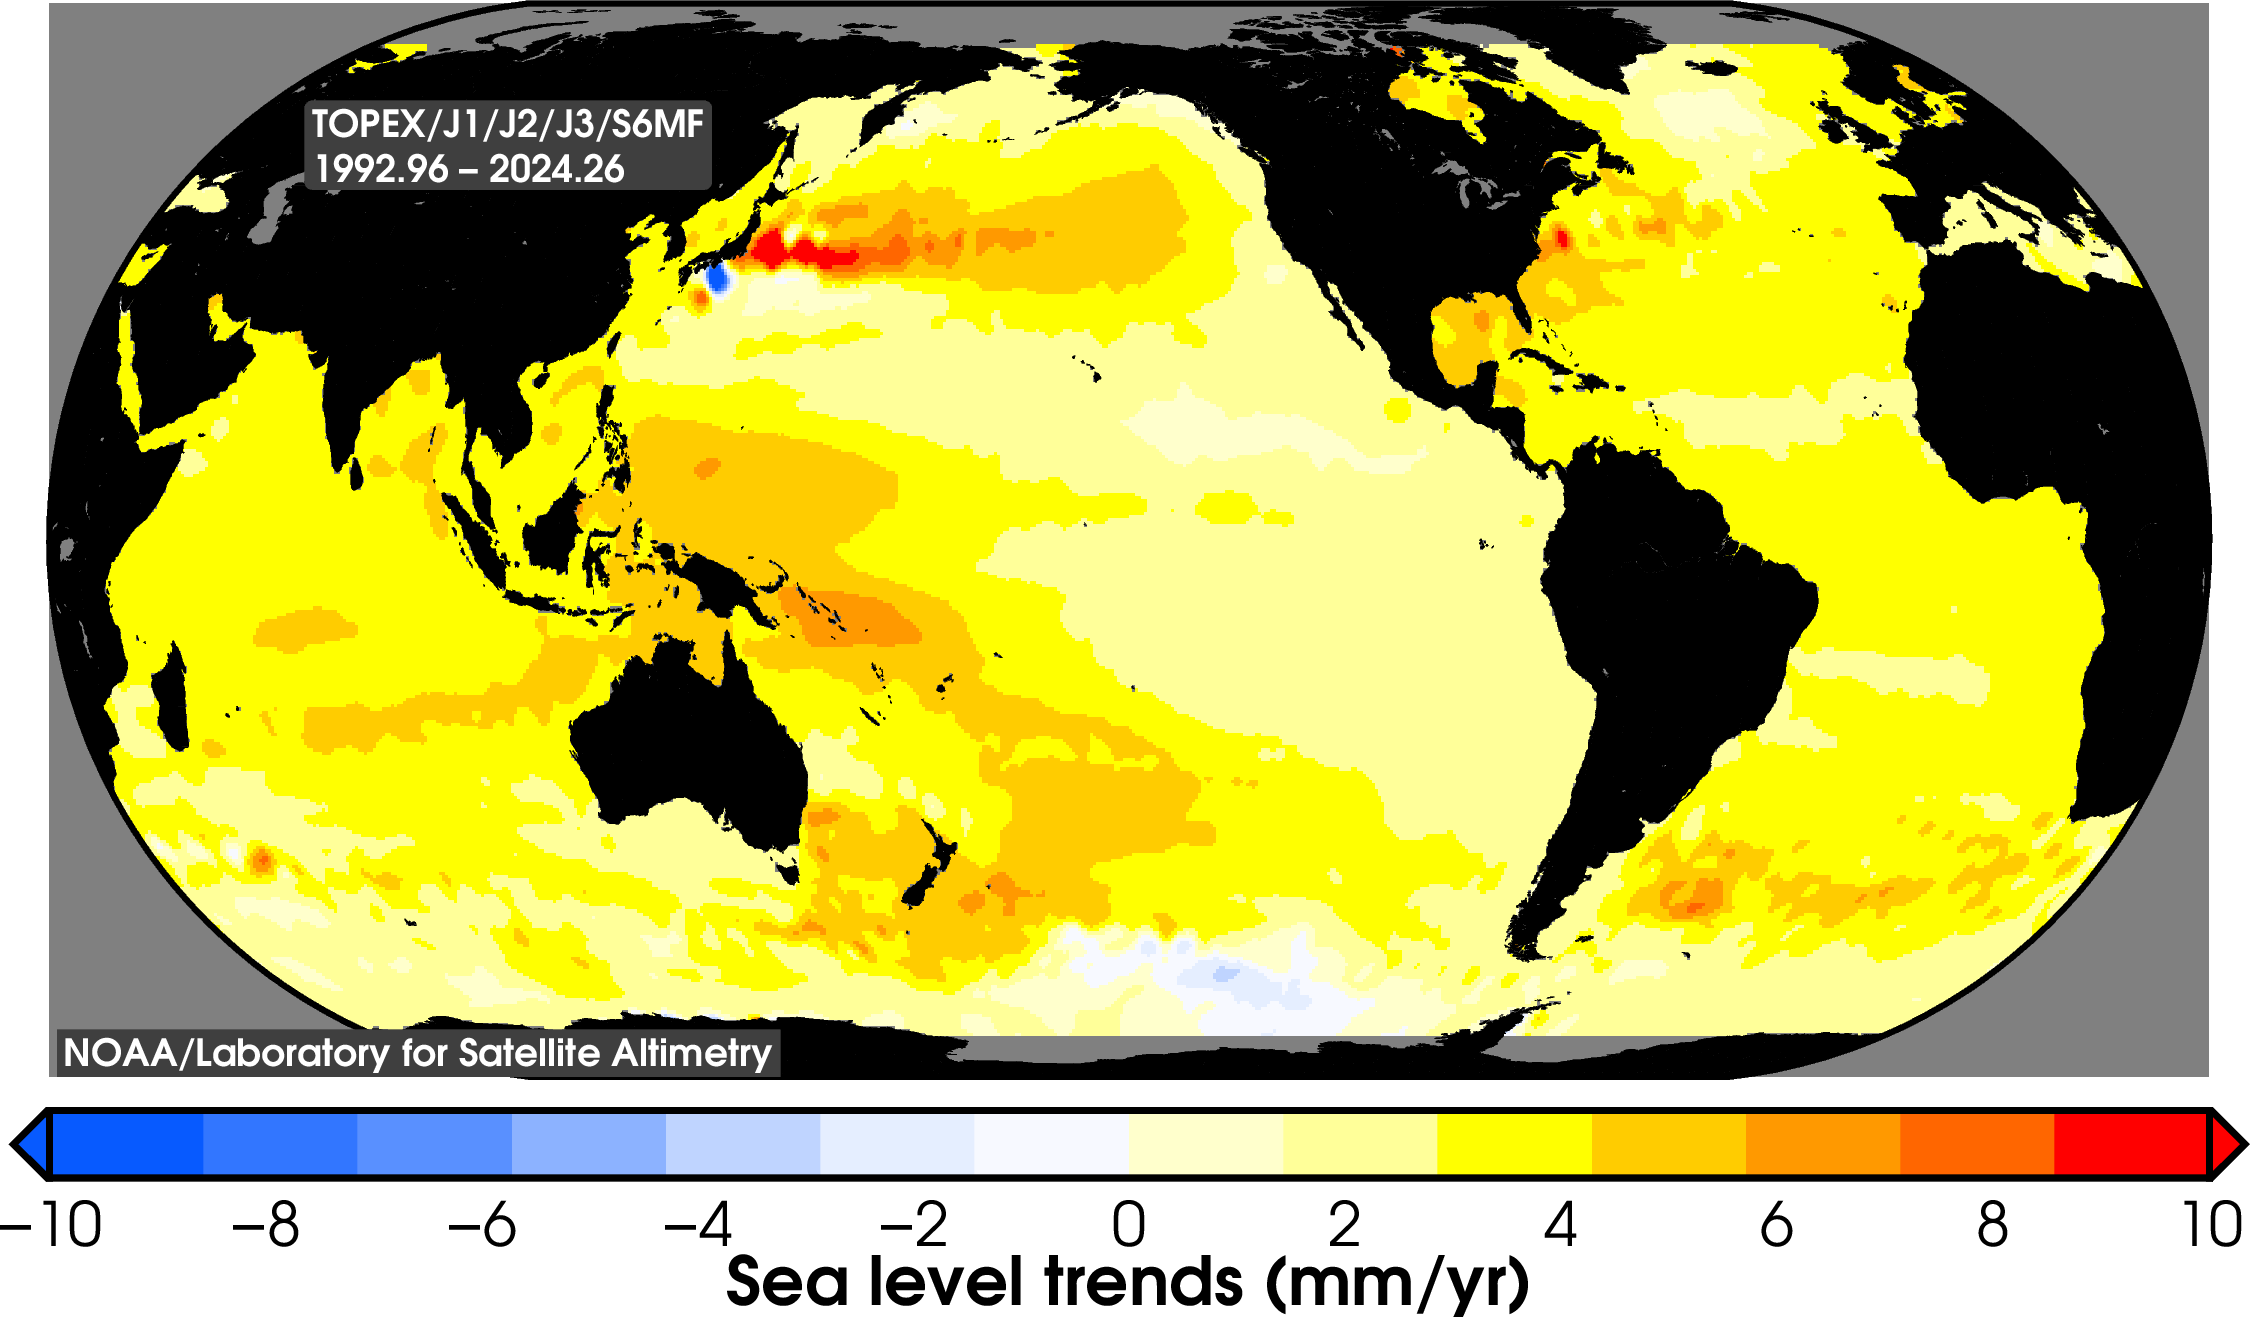  |
Color table: no_green A 573 kB pdf opens in a new window. A 262 kB png opens in a new window.   |