
Hurricane Intensity Estimation
Background
The Hurricane Intensity algorithm will make use of the ABI longwave infrared window band to monitor changes in the cloud top temperature near the tropical cyclone center. An analysis of the cloud top temperature field over the tropical cyclone center, together with a cloud pattern recognition analysis, enables the retrieval of an intensity estimate for the tropical cyclone valid at the time of the ABI image. The tropical storm intensity estimate is output as maximum sustained 1-minute surface winds (Kts), and minimum sea level pressure (MSLP) at the center (hPa) of the tropical storm. Hurricane Intensity estimates will provide critical guidance to forecasters at tropical cyclone forecast centers regarding tropical cyclone storm intensity from storm formation, through development and maturation, to dissipation.
Product Description
The ADT algorithm generates real-time tropical cyclone (TC) intensity estimates using infrared window channel satellite imagery. The primary products generated by the ADT include the current intensity estimate analysis, in terms of wind speed, mean sea level pressure, and Current Intensity number (CI#), from the satellite image being interrogated as well as additional time-averaged and other time-dependent estimate values utilizing specific rules to limit the growth/decay of the intensity estimates over time. Graphical and textual listings of the historical ADT TC estimates can be viewed, saved, and distributed.
Improvements and Benefits
GOES-R will provide high spatial and temporal resolutions which will improve the accuracy of the hurricane intensity output.
How does it work? - Algorithm
The HIE algorithm is based upon the simple premise that various cloud patterns and cloud top temperatures values/fields are related to the current tropical cyclone intensity. Tropical cloud regions that are less organized possess isolated and short-lived convective regions. As these regions become more organized, the convection becomes stronger and more widespread. The released latent heat from the convection supplies further energy to the convective region to increase the duration and vigor of the convection, leading to stronger wind speeds as the pressure within the organizing tropical system decreases related to the surrounding environmental pressure. The process continues to feed upon itself, with stronger convection releasing greater amounts of latent heat and a further reduction in the storm central pressure, which increased the geostrophic and ageostrophic wind speed wind around the storm.
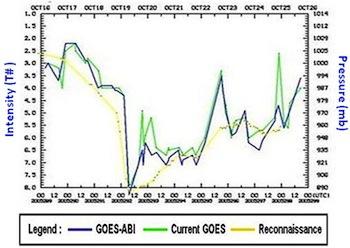
Example results of Hurricane Intensity estimates as derived from the GOES-R Hurricane Intensity Algorithm over the lifetime of Hurricane Wilma using 4km GOES-12 imagery (green) and 2km GOES-R ABI proxy data (blue). Aircraft reconnaissance intensity observations ("truth") are shown in yellow.
As the convection continues to organize and intensify the satellite-observed cloud top temperature values decrease as the tops of the storms reach higher into the troposphere. Further increase in storm organization enhances the TC secondary circulation, leading to a more symmetrical convective appearance and the development of an eye feature at the center of the storm system. Various environmental factors, such as wind shear, sea surface temperature changes, and land/weather system interactions will limit the maximum intensity of the storm and/or lead to a decrease in the storm intensity through a disruption the convective processes driving the storm development.
Monitoring the changes in convective cloud patterns and cloud-top temperature values from satellite platforms over time can provide vital information about the organization and strength of the storm being observed. Relating these patterns and values to storm intensity is the objective of the HIE. Utilization of infrared imagery from geostationary satellites provides the ideal data to perform this function.
See the GOES-R ATBD page for all ATBDs.
How are the results compared to existing data? - Calibration and Validation
Validation of hurricane intensity estimates are compared to either in situ aircraft reconnaissance measurements of tropical cyclone (TC) maximum wind speed measurements or Best Track storm information provided from an official TC forecast center. The Best Track is based on analysis of in situ observations, estimates from remote sensing methods/applications, and TC forecast methodology. A real-time "Working Best Track" may include inaccuracies while the "Final Best Track" is available after extensive analysis of all data. "Ground Truth" data can be easily obtained via NOAA "Family of Services" or FTP sites (such as NOAA/NHC).
A more technical validation presentation, (PDF, 10.27 MB) is also available.