MiRS Sensors
GPM GMI Overview

photo: GPM Microwave Imager
Satellite(s)
Global Precipitation Measurement (GPM)
MiRS Production Status
Currently operational
| Channel No | Central Frequency (Ghz) | Central Frequency Stabilization (±MHz) | Bandwidth (Mhz) | Polarization | Integration time (ms) | NEDT (K) | Antenna beamwidth @ 3dB (º) |
|---|---|---|---|---|---|---|---|
| 1 | 10.65 | 10 | 100 | V | 9.7 | 0.96 | 1.75 |
| 2 | 10.65 | 10 | 100 | H | 9.7 | 0.96 | 1.75 |
| 3 | 18.70 | 20 | 200 | V | 5.3 | 0.84 | 1.00 |
| 4 | 18.70 | 20 | 200 | H | 5.3 | 0.84 | 1.00 |
| 5 | 23.80 | 20 | 400 | V | 5.0 | 1.05 | 0.90 |
| 6 | 36.50 | 50 | 1000 | V | 5.0 | 0.65 | 0.90 |
| 7 | 36.5 | 50 | 1000 | H | 5.0 | 0.65 | 0.90 |
| 8 | 89.00 | 200 | 6000 | V | 2.2 | 0.57 | 0.40 |
| 9 | 89.00 | 200 | 6000 | H | 2.2 | 0.57 | 0.40 |
| 10 | 166.0 | 200 | 3000 | V | 3.6 | 1.5 | 0.40 |
| 11 | 166.0 | 200 | 3000 | H | 3.6 | 1.5 | 0.40 |
| 12 | 183.31±3 | 200 | 3500 | V | 3.6 | 1.5 | 0.4 |
| 13 | 183.31±7 | 200 | 4500 | V | 3.6 | 1.5 | 0.4 |
- V: Polarization vector is parallel to scan plane at nadir
- H: Polarization vector is perpendicular to scan plane at nadir
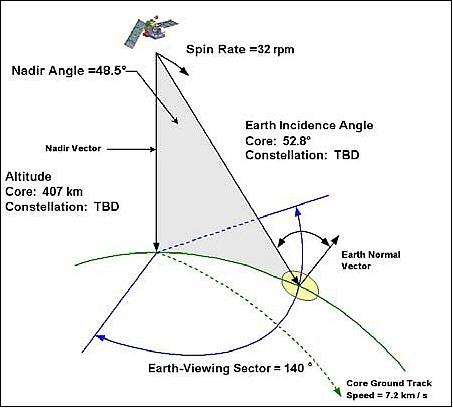
Scan geometry of GMI (image credit: NASA)
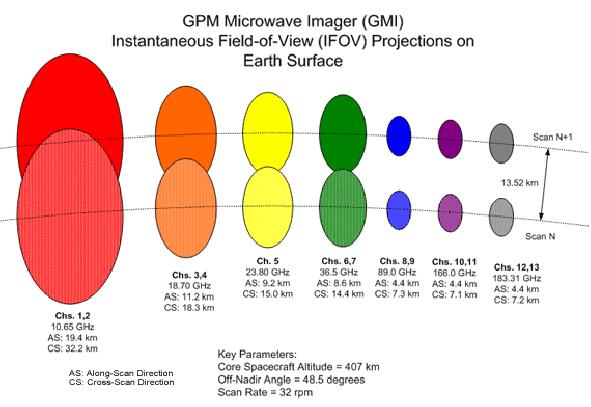
Channel footprint scheme of GMI in successive along-scans (image credit: NASA)
Notes:
Source: NASA GMI site
Source: NASA GMI ATBD
Source: eoportal.org