
Laboratory for Satellite Altimetry / Sea Ice and Polar Dynamics Science Team
Airborne Sea Ice Freeboard
Sea ice freeboard is defined as the height of floating ice above the sea surface. The sea ice freeboard product is derived from Airborne Topographic Mapper (ATM) lidar elevation data acquired during the late winter months of March, April, and May during NASA's annual Operation IceBridge (OIB) airborne campaigns in the Arctic.
The freeboard methodology uses only surface elevation measurements from the ATM, exploiting physical and geometrical characteristics to identify refrozen leads in the ice pack and use their elevation measurements as a proxy for SSH measurements. Geophysical influences are removed from ATM surface elevation measurements using models for ocean tides, solid earth tides, and mean sea surface, reducing the elevation field to represent sea ice topography alone. Refrozen leads are detected through a multistage process. The standard deviation of elevation measurements within a grid cell (numbered red boxes, Figure 1) is used to identify smooth, level cells. A 50-km sliding window is then propagated along the flight track, selecting the lowest of these smooth, level cells (small blue dots, Figure 2). Lastly, a condition is placed that the rate of change in elevation between two adjacent level, low cells must not exceed 10 cm per 50 km along-track. This is a slope condition designed to mitigate large vertical jumps. These grid cells are tagged as tie-points (blue diamonds, Figure 2) and used to estimate an SSH profile along the flight-line using linear interpolation (green line, Figure 2). With an SSH profile established, a freeboard estimate is easily calculated by subtracting the SSH value from each grid cell’s sea ice elevation mean. This results in a freeboard value for each of the 10 across-track grid cells for every 10 meters along-track.
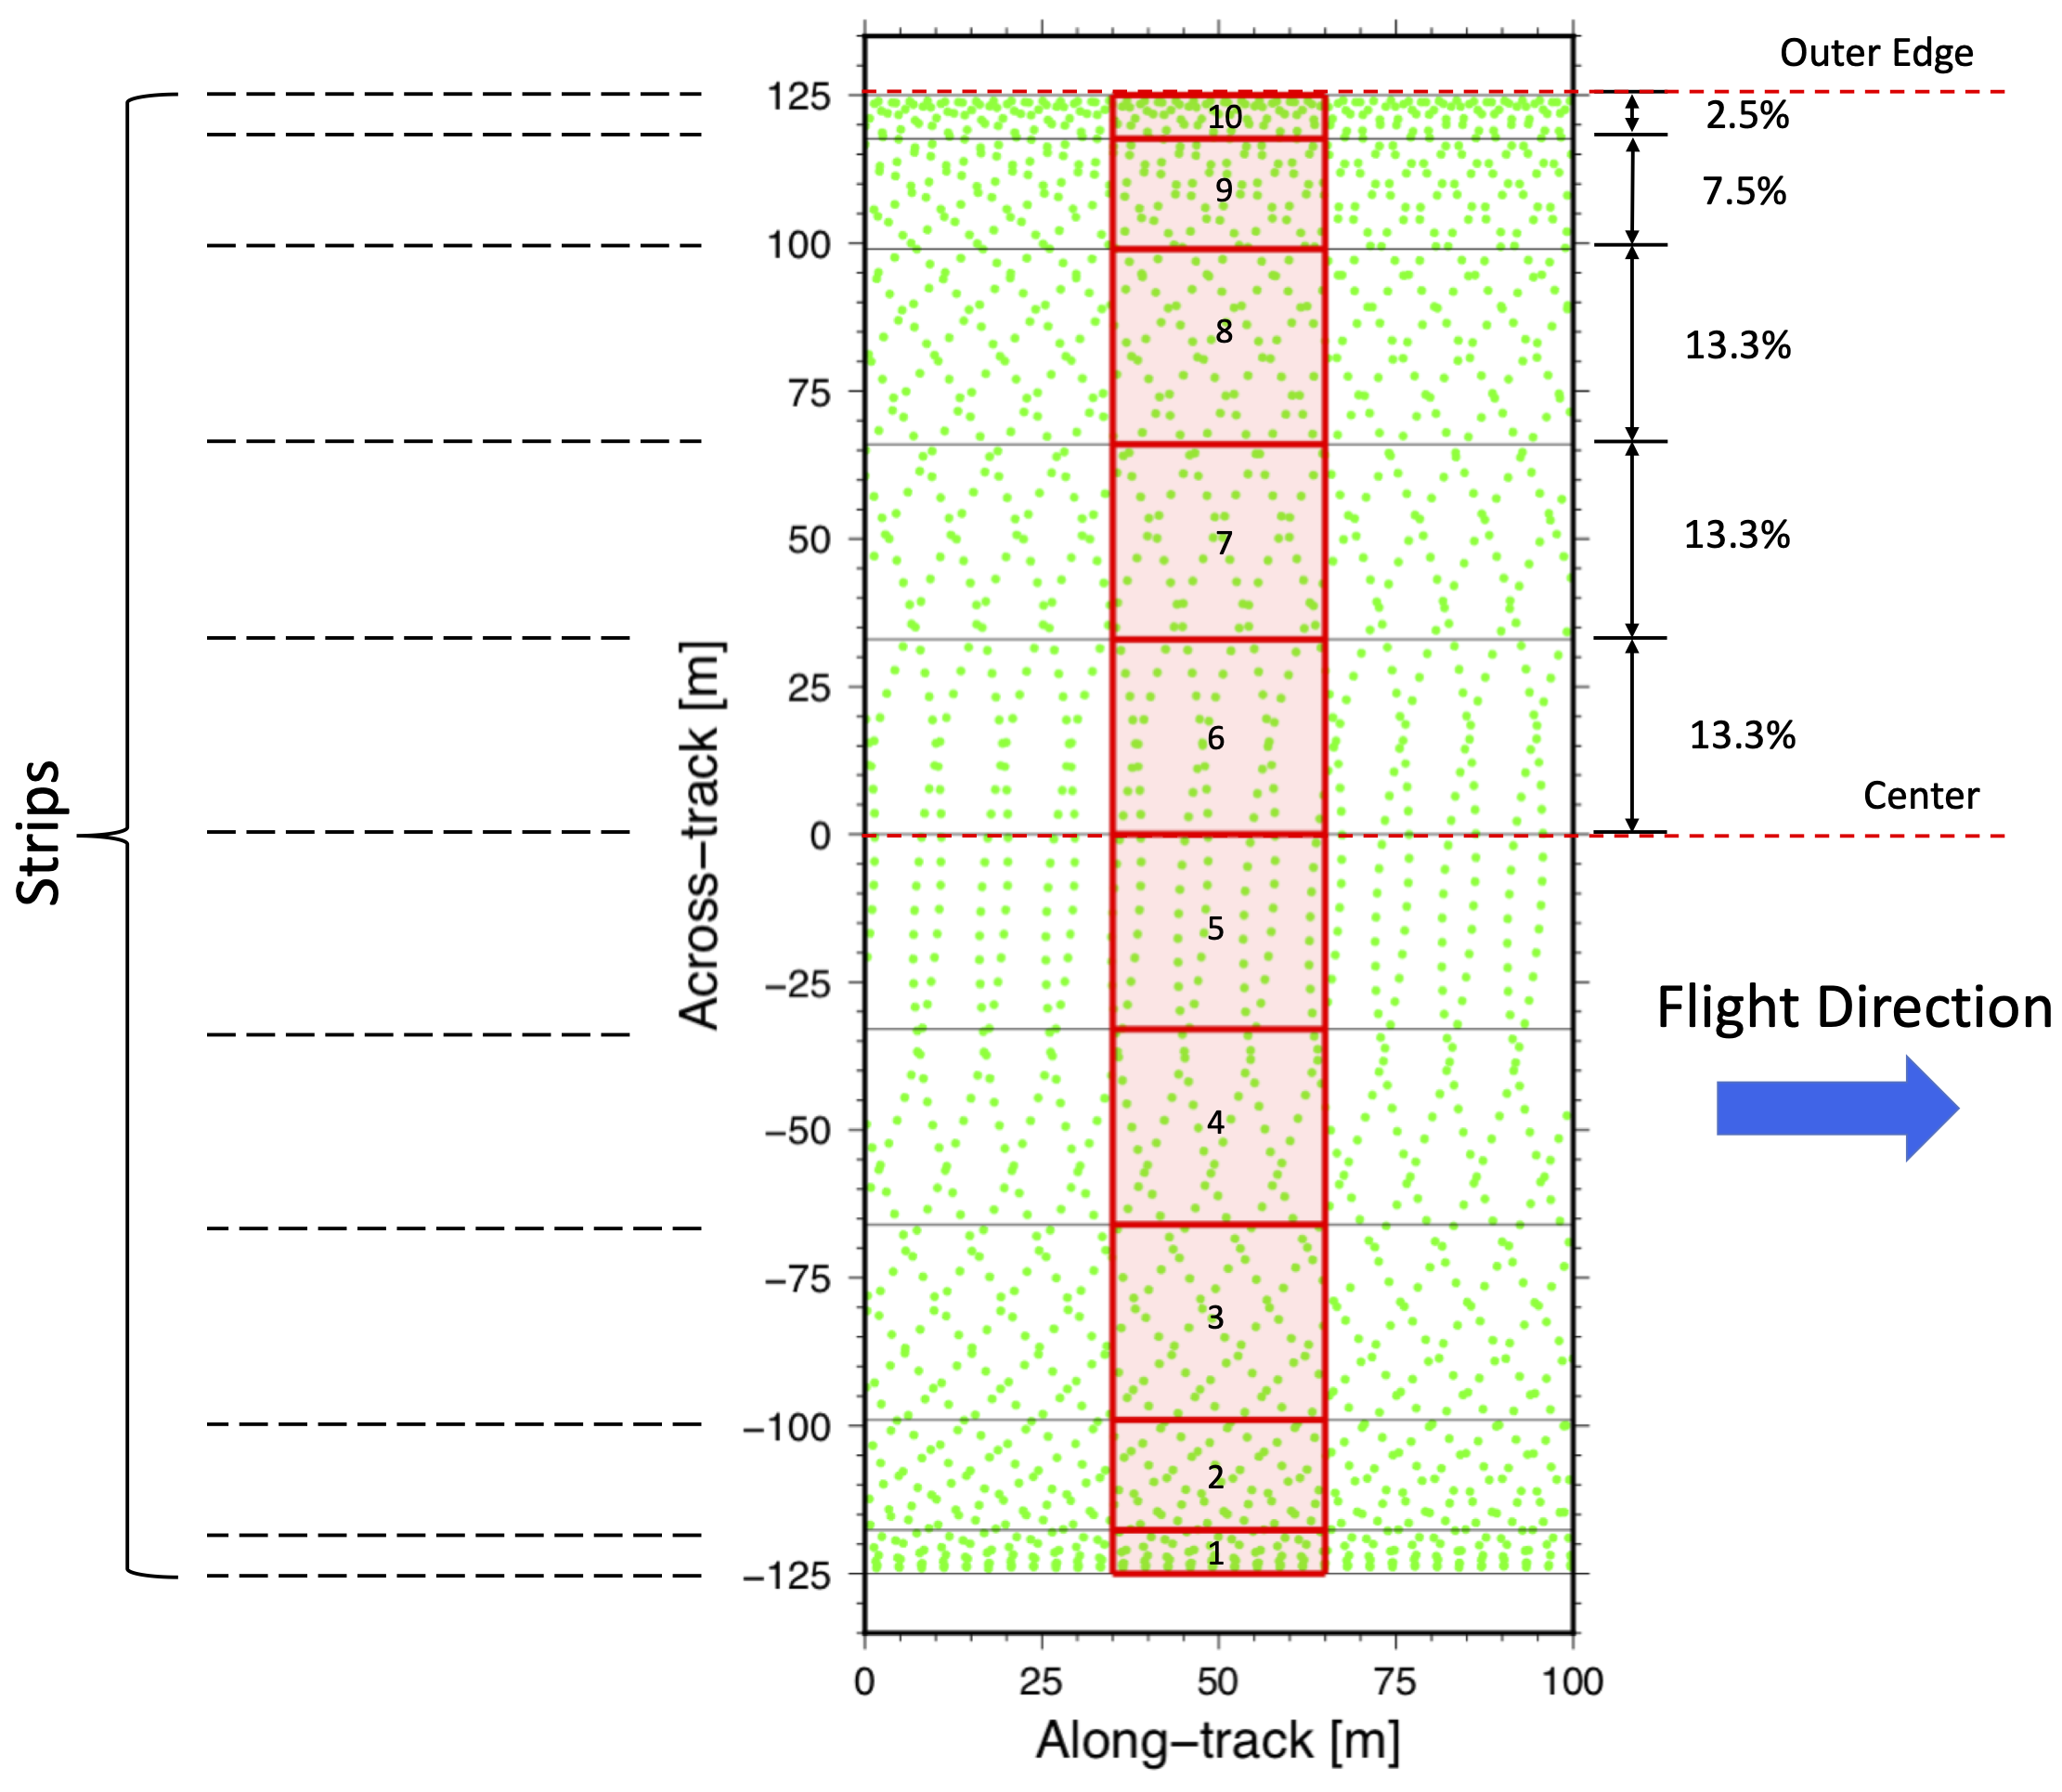
Figure 1. Depiction of grid configuration applied to ATM lidar elevation data in the derivation of the surface elevation product. Grid cells are numbered in the across-track direction using a column reference value of 1–10.
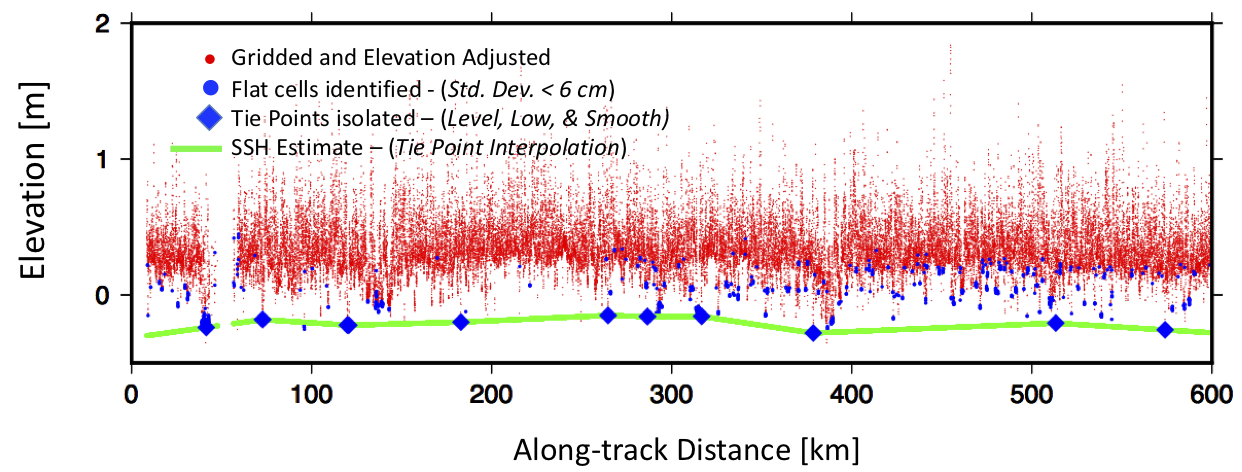
Figure 2. Example of ATM gridded elevation profile demonstrating lead detection and SSH processing. Small red dots are mean grid cell elevations. Small blue dots indicate flat ice grid cells with elevation std. dev. < 6 cm. Blue diamonds are tie-points resulting from the level, low, and smooth lead detection processing. Tie points are connected through linear interpolation along-track to construct an SSH profile (green line).
Data Product and Data Access
The NOAA / NESDIS / STAR / Laboratory for Satellite Altimetry (LSA) Polar Ocean Data System (PODS) Arctic Sea Ice Freeboard is derived from ATM lidar elevation measurements acquired during annual, low-altitude NASA OIB airborne surveys over Arctic sea ice. ATM measurements were acquired between March and May, 2009–2018. The freeboard is derived along-track, per grid cell, for each aircraft flight line.
Acknowledgment:Users are free to use the information hosted on this site in their research, provided credit is given to the NOAA / NESDIS Center for Satellite Applications and Research (STAR) Laboratory for Satellite Altimetry (LSA). Users are also asked to cite the following publication whenever these data are used: Connor, L., S. Farrell and D. McAdoo (2017), A decadal study of interannual variability in Arctic sea ice freeboard using airborne laser altimetry (2006-2016), presented at the 2017 IGS International Symposium on Polar Ice, Polar Climate, and Polar Change, Boulder, Colorado, 14-19 Aug. 2017. https://www.igsoc.org/symposia/2017/boulder/proceedings/procsfiles/procabstracts_71.html#A2583
Data access:
Point of Contact: Laurence.Connor@noaa.gov
End Users
The sea ice freeboard product enables physics-based estimates of the thickness and mass of sea ice, in turn providing sources, sinks, and constraints on polar thermodynamics and dynamics. It can be used for sea ice forecasting and high-resolution sea ice models. It also provides a basis for calibration and validation for freeboard and thickness measurements derived from satellite altimetry missions such as Sentinel-3A/B, CryoSat-2, and ICESat-2. End users of this sea ice data product include modelers and academia conducting basic research.