
Laboratory for Satellite Altimetry / Sea Ice and Polar Dynamics Science Team
Airborne Sea Ice Products
The past two decades of satellite altimetry observations have provided dense, near-total coverage of the Arctic ice cover and have proven to be a revolutionary tool for monitoring sea ice thickness [Laxon et al., 2013; Sallila et al., 2019]. It is imperative to understand the reliability and accuracy of these satellite altimeter measurements via validation with independent measurements.
Since 2002, there has been a successful international partnership between the NOAA Laboratory for Satellite Altimetry, the European Space Agency (ESA) and NASA Goddard Space Flight Center (NASA cryo) to perform validation flights of Envisat, ICESat, CryoSat-2, Sentinel 3A/B and ICESat-2 with zero or near-zero latency between satellite orbits and airborne surveys. In 2002, coincident airborne radar and laser altimeter data were collected in tandem with ESA ERS-2 and Envisat orbits, demonstrating for the first time the value of independent validation campaigns over sea ice [Giles et al., 2007]. The ESA CryoVEx program, which also started in 2002, is dedicated to validating CryoSat over both land and sea ice surfaces. Between 2002 and 2019 a total of 99 dedicated under-flights of space-borne altimeters have been conducted over Arctic sea ice (Figure 1).
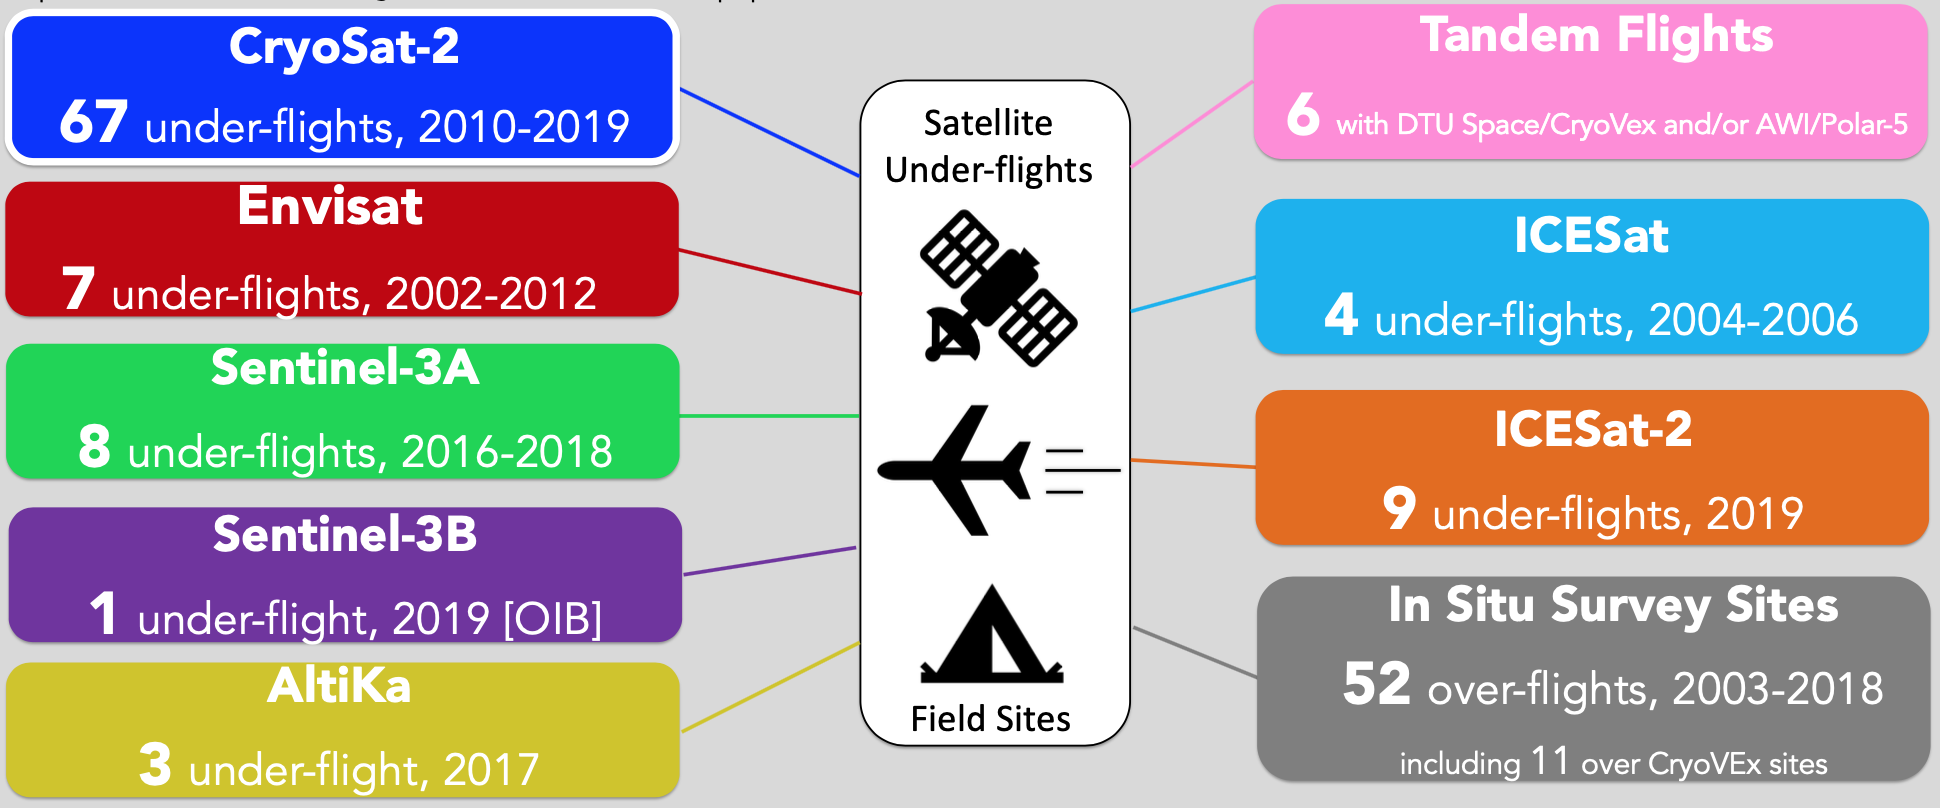
Figure 1. Airborne validation flights over Arctic sea ice conducted by OIB, ESA CryoVEx, DTU-Space and AWI between 2002 and 2019. This includes 99 dedicated under-flights of space-borne altimeters, 52 surveys above field sites, and 6 tandem flights of multiple instrumented-aircraft.
Between 2009 and 2019, NASA Operation IceBridge (OIB) provided further opportunity for international collaboration to validate satellite and airborne altimeters (Figure 2). OIB coordinated with NOAA, ESA CryoVEx, DTU Space and AWI to obtain a total of 67 under-flights [Haas et al., 2016] of CryoSat-2 and 6 tandem surveys with multiple aircraft (Coordinated Activities Table). As part of these experiments, there were 52 aircraft surveys above Arctic field sites where in situ measurements were collected [Haas et al., 2017]. Together these validation experiments have demonstrated the reliability of CryoSat-2 to accurately measure sea ice thickness [Laxon et al., 2013].

Figure 2. NASA Operation IceBridge (OIB) airborne flight surveys coordinated with satellite altimeter orbit crossings of Arctic sea ice between 2009 and 2019. OIB under-flew five different satellites during this period including Envisat (red), CryoSat-2 (blue), Sentinel-3A (green), Sentinel-3B (purple) and ICESat-2 (orange). A wide range of validation data were collected from multiple instruments onboard the NASA OIB aircraft.
The instrumentation suite deployed by OIB included the Airborne Topographic Mapper (ATM) scanning lidar altimeter, a radar altimeter deployed along with a frequency modulated continuous wave (FMCW) snow radar and the Digital Mapping System (DMS) high-resolution digital camera. These instruments provided high-resolution measurements of Arctic sea ice from which surface elevation, surface roughness, snow depth, pressure ridge sail height, freeboard and thickness could be derived [Farrell et al., 2012; Newman et al., 2014; Duncan et al., 2020]. OIB flew 11 late-winter campaigns (March, April May) during which a total of 104 sea ice surveys were completed mainly over the Western Arctic (-150°W to 30°E longitude). These missions have proven to be crucial in helping the sea ice community better understand the geophysical characteristics and variability of the sea ice cover including its snow depth and ice thickness [Richter-Menge and Farrell, 2013]. The OIB measurements have been used to generate a suite of six NOAA LSA Polar Ocean Data System (PODS) Arctic Sea Ice Airborne Data Products (Table 1).
|
Arctic Sea Ice Airborne Data Products |
Sensor |
Data Range |
|||
|
Freeboard |
Airborne Topographic Mapper (ATM) |
2009 to 2018 |
✔ |
August 2021* |
August 2021 |
|
Pressure Ridge Sail Height |
Digital Mapping System (DMS) |
2010 to 2018 |
✔ |
✔ |
✔ |
|
Surface Roughness |
Airborne Topographic Mapper (ATM) |
2009 to 2018 |
✔ |
✔ |
July 2021 |
|
Snow Depth |
FMCW Snow Radar |
2009 to 2012, 2014, 2015 |
✔ |
✔ |
August 2021 |
|
Summer Melt |
Digital Mapping System (DMS) |
2016, 2017 |
✔ |
✔ |
August 2021 |
|
Surface Elevation |
Airborne Topographic Mapper (ATM) |
2009 to 2018 |
✔ |
June 2021 |
July 2021 |
*The Freeboard product will be archived at NSIDC, https://nsidc.org
Table 1. Availability of NOAA / NESDIS / STAR / Laboratory for Satellite Altimetry (LSA) Polar Ocean Data System (PODS) Arctic Sea Ice Airborne Data Products.
The launch of ICESat-2 in September 2018, with its high-resolution photon counting lidar, is advancing spaceborne remote sensing of sea ice [Markus et al., 2017]. With a footprint diameter of ~11 m [Magruder et al., 2020] and 0.7 m along-track sampling, ICESat-2 is capable of obtaining measurements in narrow leads allowing for more accurate freeboard and thickness measurements compared to ICESat. [Farrell et al., 2020] found that topographical surface features (e.g., individual sea ice floes and pressure ridges), as narrow as 7 m, could be measured. The ICESat-2 laser altimeter, operating at a wavelength of 532 nm, has the capability to penetrate the water column in clear, calm conditions. [Farrell et al., 2020] demonstrated that the bathymetry and depth of melt ponds on summer sea ice can now be measured from a space-based platform for the first time.
Summary Description of NOAA / NESDIS / STAR / Laboratory for Satellite Altimetry (LSA) Polar Ocean Data System (PODS) Arctic Sea Ice Airborne Data Products
Freeboard
Height of floating sea ice above the sea surface. Derived from Airborne Topographic Mapper (ATM) lidar elevation data acquired during winter Operation IceBridge (OIB) campaigns, 2009-2019. The freeboard product is gridded at 30 m along-track resolution for each across-track grid cell. Freeboard is found to be highest in the multiyear sea ice north of Greenland and the Canadian Archipelago with a gradient to lower freeboards towards the central Arctic Ocean.
Pressure-Ridge Sail-Height
Height of the ridge sail above the sea ice surface. Derived from high-resolution Digital Mapping System (DMS) imagery acquired during late winter Operation IceBridge campaigns, 2010-2018. Sail height statistics are extracted per image and arithmetic averages are computed for 25 km along-track segments. The data show that pressure-ridge sail height depends on the parent ice from which it is formed, with higher mean sail heights (1.1 – 1.3 m) found in the thicker multiyear ice north of Greenland and the Canadian Archipelago compared to lower mean sail heights (0.8 – 1.0 m) found within the thinner first-year ice regions of the Beaufort Sea and north of Svalbard [Duncan et al., 2020].
Surface Roughness
Standard deviation of elevation per unit area. Derived from ATM lidar elevation data acquired during late winter OIB campaigns, 2009&ndash2019. The surface roughness product is gridded at 30 m along-track resolution for each across-track grid cell. The surface roughness data show that the roughest ice (elevation standard deviation of 0.3 m and greater) corresponds to the thicker multiyear ice north of Greenland and the Canadian Archipelago with a gradient to thinner and less rough (elevation standard deviation of 0.1 – 0.2 m) ice towards the central Arctic Ocean and Beaufort Sea regions.
Snow Depth
Snow depth on Arctic sea ice is derived from Center for Remote Sensing of Ice Sheets (CReSIS) Frequency Modulated Continuous Wave (FMCW) snow radar data acquired during late winter OIB campaigns, 2009-2012, 2014 and 2015 [Newman et al., 2014]. Snow depth statistics are computed for 10 km along-track segments [Arctic Report Card, 2017]. Snow depths are shown to be deepest (0.4 m and greater) on the multiyear ice region north of Greenland with thinner snow depths (0.15 – 0.25 m) in the Beaufort Sea region where predominantly thinner first-year ice is located.
Summer Melt
DMS imagery acquired during summer OIB campaigns in July 2016 and 2017 is classified into seven distinct categories: image border, undeformed/deformed sea ice, open water, and dark, medium, and light melt ponds. Geophysical parameters such as melt pond and color fraction, and sea ice concentration are derived per image. Melt pond fraction (sea ice concentration) was found to be lower (higher) within multiyear ice regions and higher (lower) in first-year ice regions. Pond color was found to be lighter on the multiyear sea ice and darker on first-year sea ice [Buckley et al., 2020].
Surface Elevation
Sea ice surface elevation is derived from ATM lidar data acquired during late winter OIB campaigns, 2009-2019. The surface elevation product is gridded at 30 m along-track resolution for each across-track grid cell.