
Laboratory for Satellite Altimetry / Sea Ice and Polar Dynamics Science Team
High-resolution Summer Sea Ice Melt Feature Classification
In July 2016 and 2017, Digital Mapping System (DMS) natural color, optical imagery were acquired over Arctic sea ice as part of NASA's Operation IceBridge (OIB) airborne campaigns. Buckley et al. (2020) describe a classification algorithm that exploits the red, green, and blue (RGB) channels of these high-resolution DMS images to classify pixels into seven distinct categories: image border, undeformed sea ice, deformed sea ice, open water, dark melt pond, medium melt pond, and light melt pond (Figure 1). For each image, meaningful geophysical parameters have been derived: melt pond fraction, sea ice concentration, and pond color fraction. Melt pond fraction is the percentage of the sea ice surface that is ponded. Sea ice concentration is the percentage of ocean covered by sea ice. Pond color fraction is the partitioning of dark, medium, and light color ponds as a percentage of total ponded area.
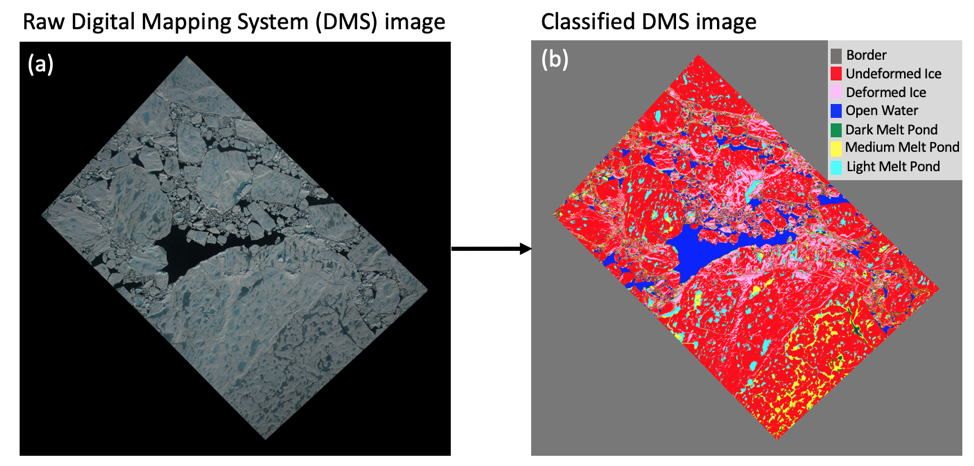
Figure 1. (a) Original DMS image of sea ice undergoing melt, acquired on July 24, 2017 in the Lincoln Sea (–51.6° W, 83.2° N). (b) Classified image derived from (a) following Buckley et al. (2020), showing pixels identified as undeformed sea ice, deformed sea ice, open water, and dark, medium and light melt ponds. Modified from Buckley et al. (2020).
Data Product and Data Access
The NOAA / NESDIS / STAR / Laboratory for Satellite Altimetry (LSA) Polar Ocean Data System (PODS) Arctic Sea Ice Summer Melt Feature Classification product is derived from high-resolution DMS imagery acquired during low-altitude NASA OIB airborne surveys over Arctic sea ice. DMS images were acquired in July, 2016 and 2017. The data products are available as:
- Classification Masks: HDF5 files containing a classification dataset with the dimensions of the original DMS GeoTIFF where each value indicates the pixel classification. Masks are available per image.
- Derived Sea Ice Melt Features: ASCII text files with geophysical features derived from the classification masks. Available per day/survey.
Acknowledgment: Users are free to use the information hosted on this site in their research, provided credit is given to the NOAA / NESDIS Center for Satellite Applications and Research (STAR) Laboratory for Satellite Altimetry (LSA). Users are also asked to cite the following publication whenever these data are used: Buckley, E. M., Farrell, S. L., Duncan, K., Connor, L. N., Kuhn, J. M., & Dominguez, R. T. (2020). Classification of Sea Ice Summer Melt Features in High‐resolution IceBridge Imagery. Journal of Geophysical Research: Oceans, 125, e2019JC015738. https://doi.org/10.1029/2019JC015738
Data access:
- https://www.star.nesdis.noaa.gov/data/socd3/lsa/SeaIceProducts/Airborne/IceBridge/SummerMelt/
- NCEI Archive
Point of Contact: Ellen Buckley ellen.buckley@noaa.gov
End Users
The Summer Melt Feature Classification data product can be used to improve the characterization of melt pond shape and fraction in sea ice models. The melt pond shapes and areas can provide information on transmission of light through the ice pack for those who study under ice ecology. This product also provides a basis for validation of melt pond measurements derived from airborne and satellite missions such as ICESat-2. End users of this sea ice data product include modelers and academia conducting basic research.