Laboratory for Satellite Altimetry / Sea Ice and Polar Dynamics Science Team
Arctic Spring 2015 Sea Ice Surveys

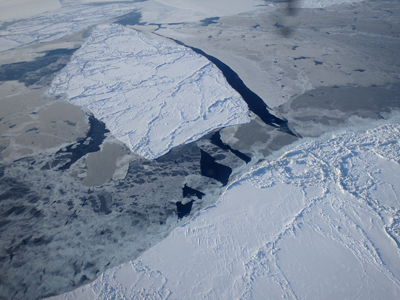
Figure 1. Aerial photograph of sea ice in the Beaufort Sea, off the coast of Barrow, Alaska, March 2014. Photo credit: Thomas Newman, CICS-MD/NOAA.
Figure 1 shows sea ice in the Beaufort Sea, off the coast of Barrow, Alaska. It illustrates the complexity of the sea ice environment which in this case includes first-year ice floes with pressure ridges and snow-drift features, areas of thin, grey ice, open water and refrozen leads. IceBridge commenced the 2015 Arctic Spring Campaign on March 19th.

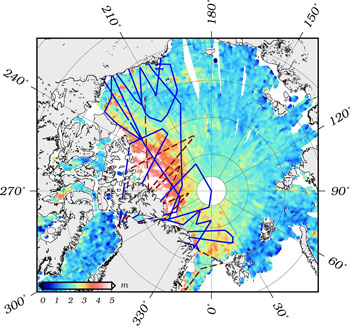
Figure 2. Aircraft surveys completed (blue lines) and planned (dashed red lines) during the IceBridge Arctic Spring Campaign 2015. Survey lines are overlaid on CryoSat-2 NRT sea ice thickness estimates provided by the UCL Center for Polar Observation and Modelling's "CryoSat Operational Polar Monitoring" project (Laxon et al., 2013). Map credit: Sinéad L. Farrell, CICS-MD/NOAA.
Figure 2 shows the flight surveys over the Arctic ice cover completed thus far (blue lines). Further surveys of the ice pack may yet be completed before the end of the Spring mission, scheduled for late May. Potential flight lines are shown as dashed red lines. Included in these plans is an underflight of the SARAL/Altika altimeter to validate Ka-band altimetry over sea ice. Unfortunately due to logistical constraints it was not possible to conduct an underflight of the SARAL/Altika in 2015. The IceBridge airborne survey lines are overlaid on recent CryoSat-2 Near Real Time (NRT) sea ice thickness estimates provided by the UCL Center for Polar Observation and Modelling's "CryoSat Operational Polar Monitoring" project (Laxon et al., 2013 and http://www.cpom.ucl.ac.uk/csopr/seaice.html).
