STAR - Global Vegetation Health Products: Validation Case Study: VHI and Yield of wheat of Australia
1. Data
- Australia's mean yield data from FAO (1961-2014)
- GIS shapefiles for major wheat areas (maps) of 5 states in Australia from USDA
- Mean weekly vegetation health index (VHI) and smoothed NDVI (SMN) for the major wheat areas during 1982-2016 from NOAA/NESDIS/Center for Satellite Applications and Research
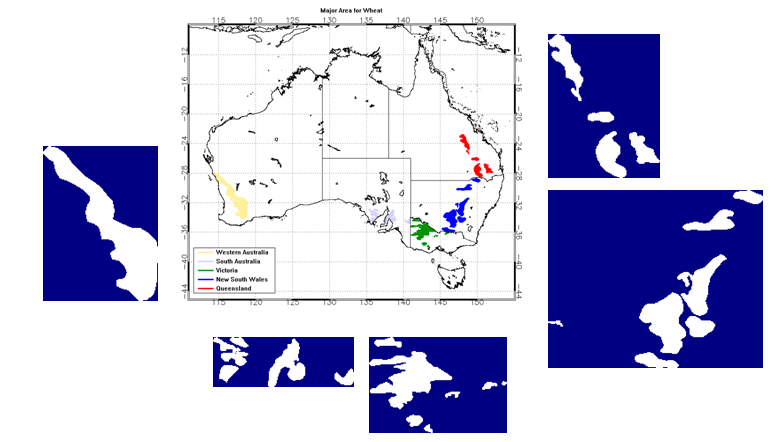
1.1 The GIS files
Spatial coverage of major Wheat Areas in 5 states of Australia were provided by USDA through GIS files, colored by states in main map and white areas in zoomed map.
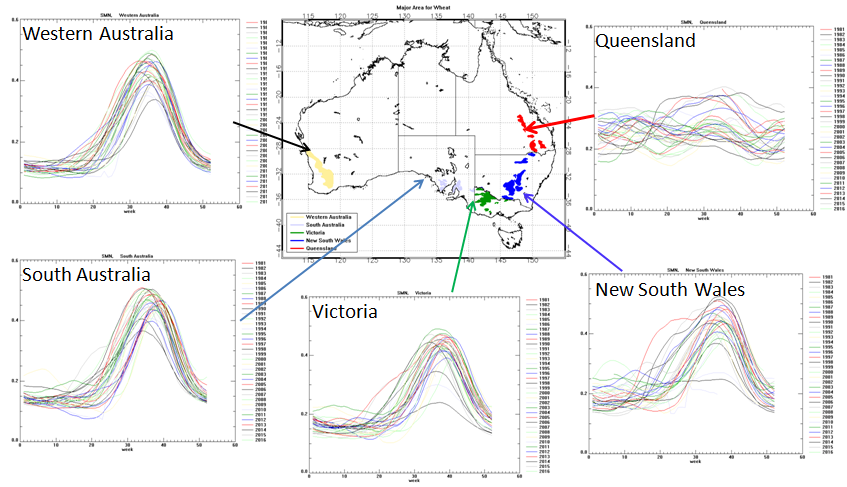
1.2 SMN time series
Smoothed NDVI data were collected from AVHRR-VHP data set for the peirod from 1981 to 2016. Areal mean SMN for major wheat Areas in 5 states were calculated. Below picture shows weekly SMN time series for each year.
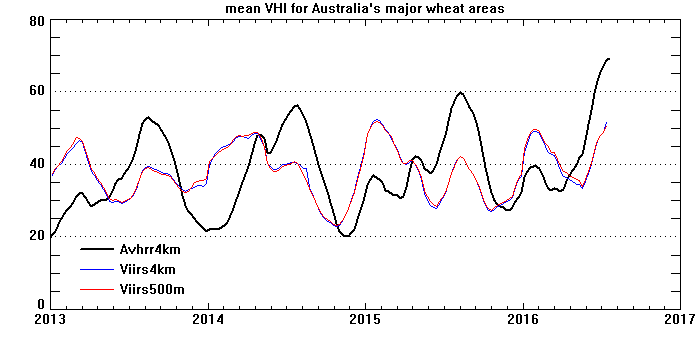
1.3 vegetation health index (VHI)
Mean weekly vegetation health index (VHI) for the major wheat areas in 5 states of Australia were collected from AVHRR-VHP data set for the peirod from 1982 to 2014. Digital data derived from AVHRR 16km VHP data set is available at here.
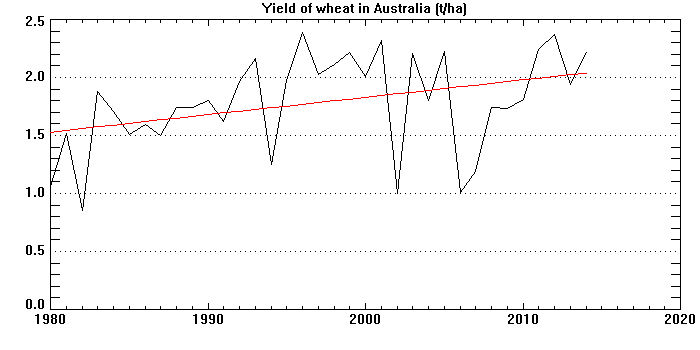
1.4 Yield of wheat
Data of yield of wheat in Australia were collected from FAO web site. https://www.fao.org/faostat.
2. Data analysis
2.1 DY
Ration of yield (DY) were calculated by removing the trend.
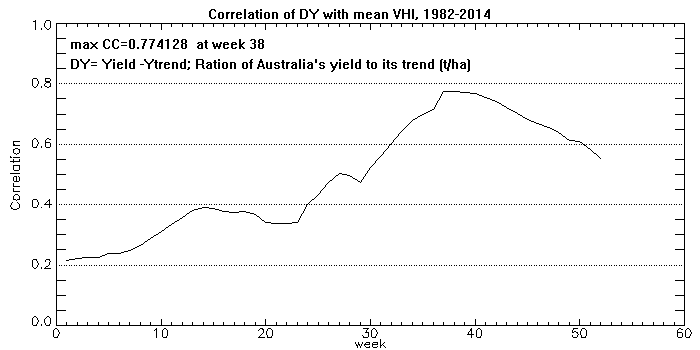
2.2 Correlation
Correlation between VHI and DY were calculated for each week. It was found the correlation coefficient reach its maximum value at week 38 (mid of September).
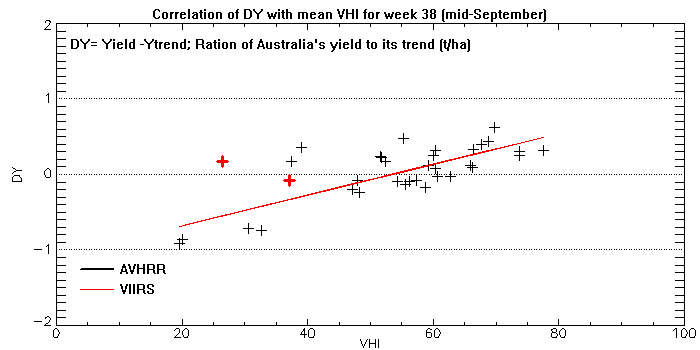
2.3 VHI and DY at week 38
Scatterplot of VHI and DY for week 38 were plotted as below: