STAR - Global Vegetation Health Products : VH _Average By Zones in Argentina
VH _Average By Zones in Argentina
The VH indices (VCI/TCI/VHI) averaged for zones in Argentina was calculated.
VH _Averaged By Zones in Argentina:
The 14 crop zones were defined by polygons in GIS shpae file files. Below shows the map of zones. left: crop zone names, right: water mask; both were used for collecting VH data:
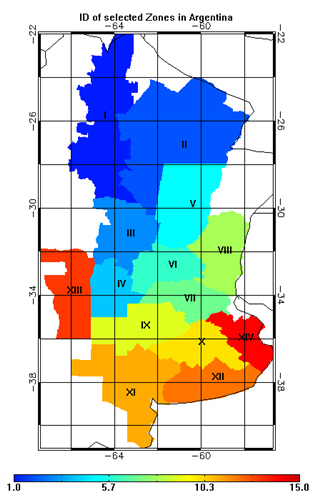 | 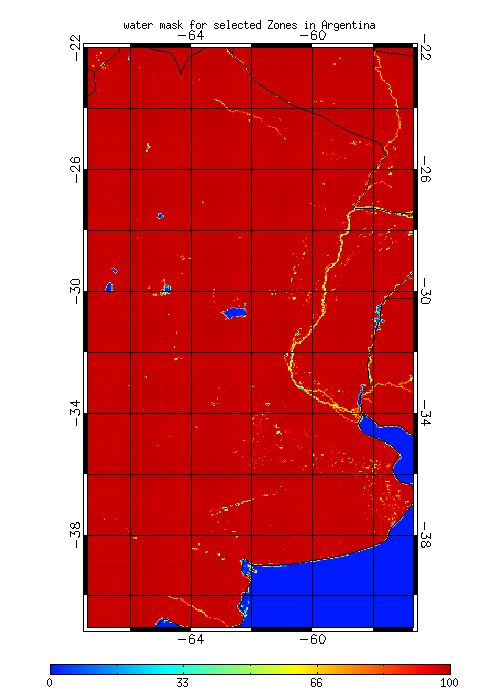 |
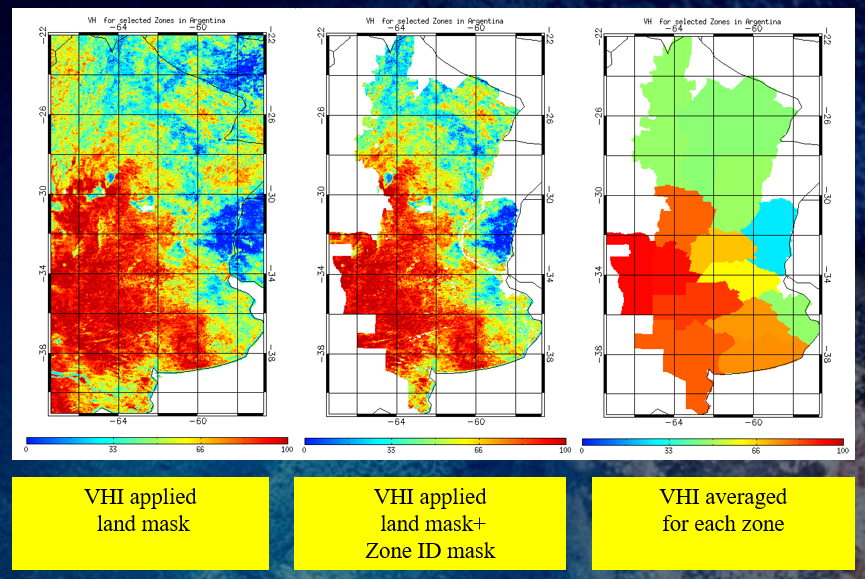
The picture below shows the VHI images of 2002 week 1, left: VHI applied water mask, middle: VHI applied zone mask, right: VHI averaged by zones
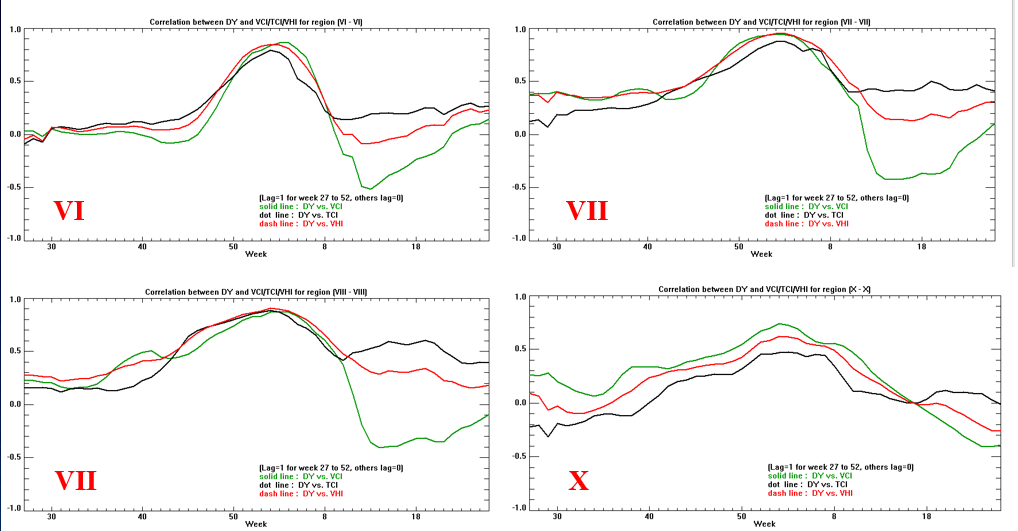
The correlation of crop yield and VHI averaged by zones.