
STAR - Global Vegetation Health Products: NPP VIIRS Daily map
"VIIRS GVI daily map" was GVI-x like product with 500m resolution, in NETCDF format.
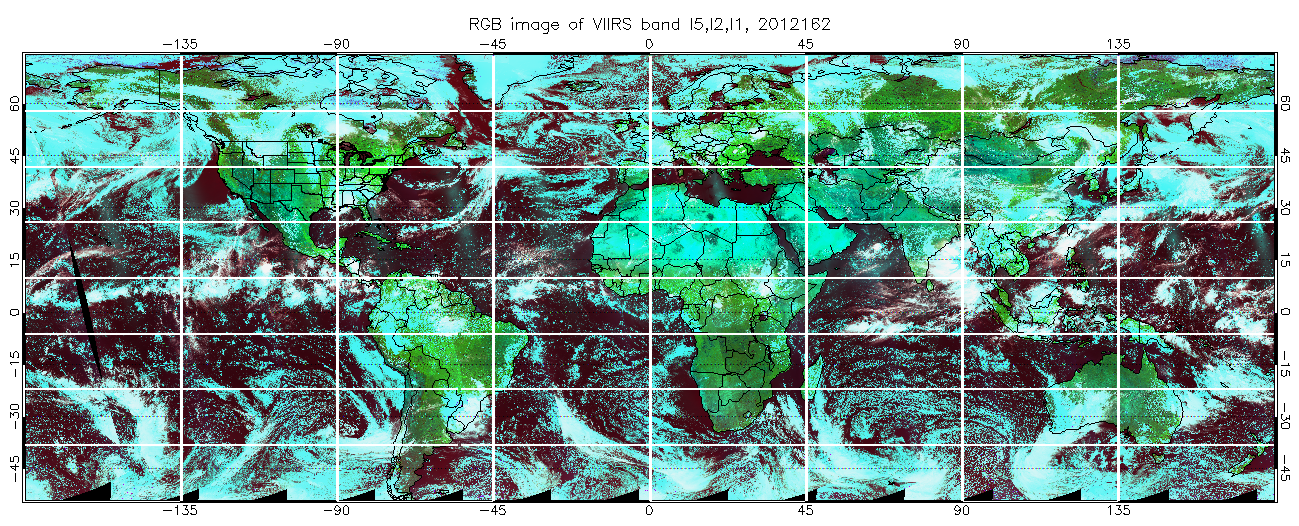
It was composed from VIIRS SDR dataset of image bands: I1 (0.600-0.680um), I2 (0.846-0.885um) and I5 (10.50-12.40um) and Moderate Band M3(0.478-0.498um). The resolution of these input images is 375m at nadir. There are 14 or 15 orbits per day, saving as about 1000 (up to 1014) granules. Geo-location information, reflectance (of image band 1 and 2), brightness temperature (of image band 5) and could mask are saved in separate files respectively. For Image bands, each granule has 6400 x 1536 pixels.
| File Type | resolution | datasets used for GVI |
|---|---|---|
| GITCO | 375m | "/All_Data/VIIRS-IMG-GEO_All/Latitude" "/All_Data/VIIRS-IMG-GEO_All/Longitude" "/All_Data/VIIRS-IMG-GEO_All/SatelliteZenithAngle" "/All_Data/VIIRS-IMG-GEO_All/SatelliteAzimuthAngle" "/All_Data/VIIRS-IMG-GEO_All/SolarZenithAngle" "/All_Data/VIIRS-IMG-GEO_All/SolarAzimuthAngle" |
| SVI01 | 375m | "/All_Data/VIIRS-I1-SDR_All/Reflectance" "/All_Data/VIIRS-I1-SDR_All/ReflectanceFactors" |
| SVI02 | 375m | "/All_Data/VIIRS-I2-SDR_All/Reflectance" "/All_Data/VIIRS-M3-SDR_All/ReflectanceFactors" |
| SVM03 | 750m | "/All_Data/VIIRS-M3-SDR_All/Reflectance" "/All_Data/VIIRS-I2-SDR_All/ReflectanceFactors" |
| SVI05 | 375m | "/All_Data/VIIRS-I5-SDR_All/BrightnessTemperature" "/All_Data/VIIRS-I5-SDR_All/BrightnessTemperatureFactors" |
| IICMO | 750m | "/All_Data/VIIRS-CM-IP_All/QF1_VIIRSCMIP" |
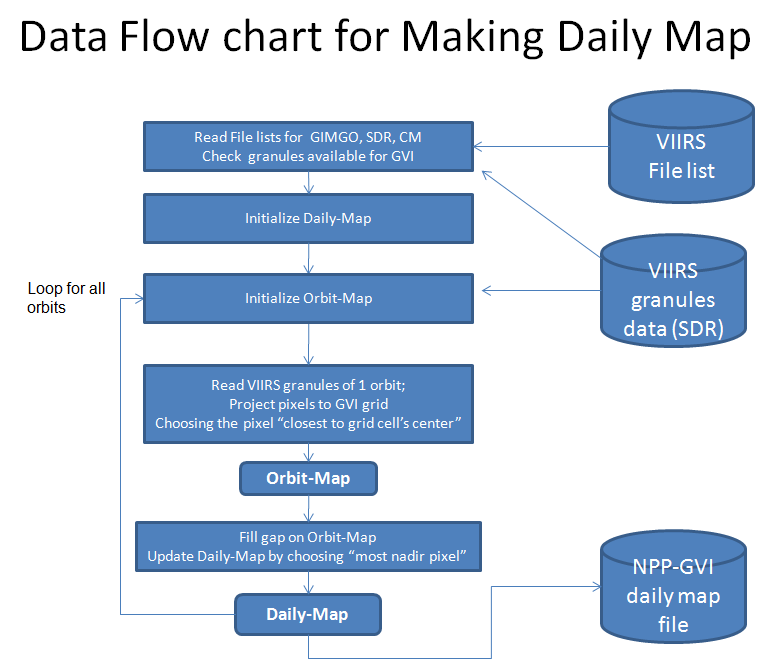
Procedure to create VIIRS GVI daily map
First, the "Orbit-Map" is created to map each granule pixel to GVI grid by slecting the
pixel closest to the center of grid cell. It may have some holes on orbit-map
if the output GVI grid is finer than the resolution of input VIIRS data
(at nadir, it is 375m for image bands and 750m for MOD band).
The holes are filled by nearest pixels.
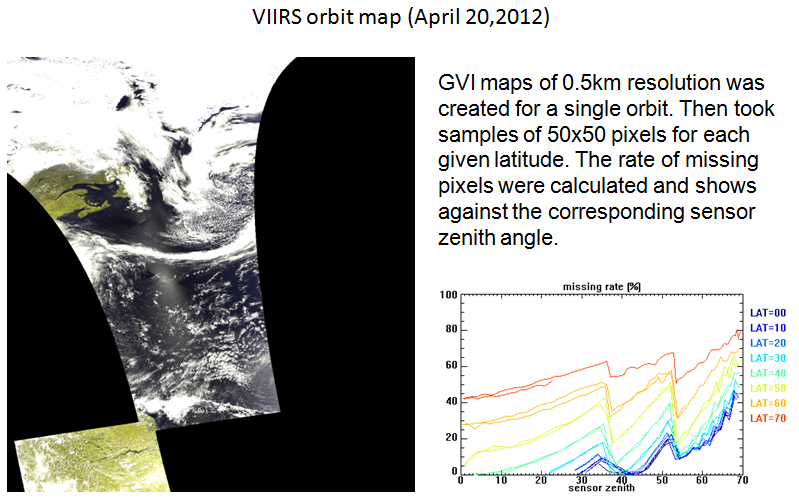
The figure below shows an example of VIIRS orbit map observed on April 19, 2012.
It also shows the rate of missing pixels varies with latitide as well as
sensor zenith angle if the holes are not filled.
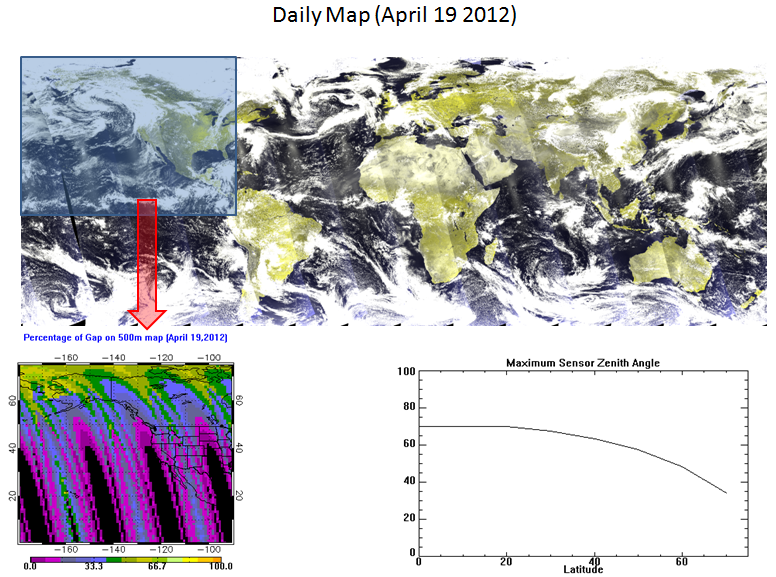
Second, orbit maps of a day are merged into daily map by selecting the most nadir one
form available pixels on orbit maps. This ensure the best data will be used, especially
for high latitude area. Below figure shows The daily map of April 19 2012 (top),
percentage of gaps on 500m daily map without gap-filling (bottom left) and the maimum sensor zenith angle if
gaps are filled (bottom right).
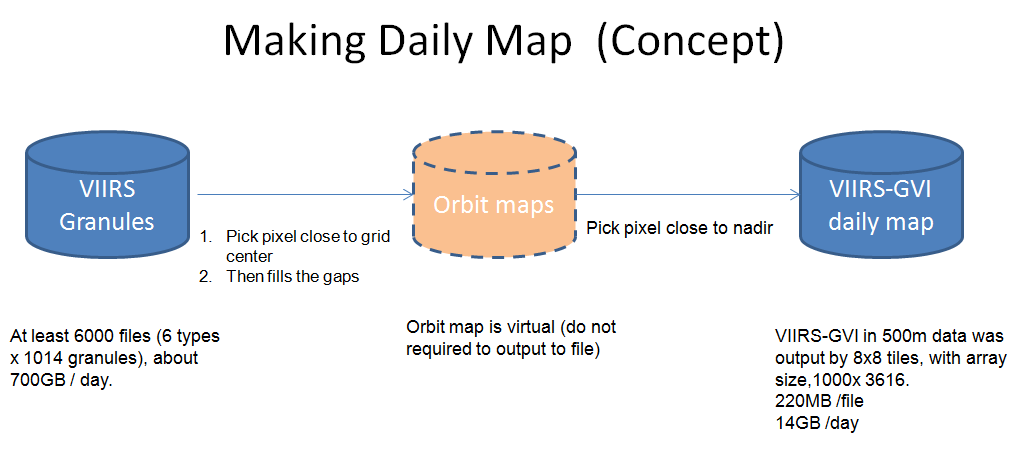
For making VIIRS GVI daily map, the challenge is huge data volume because of the high resolution.
There are at least 6000 to 21000 input files (with size 700GB to 1TB, depending on the variables to be output) are rquired to process;
If 500m VIIRS GVI daily map is genereated, the output array for thw whole GVI area will be 80000x 28928.
We have to save it by multiple files,each file covers a small region (a tile). For example, 8x8 tiles, then, we have 220MB/file, 14GB/daily map.
Data flow chart for making VIIRS daily map are described below in detail
VIIRS GVI daily map product files
"VIIRS GVI daily map" covers the same spatial range as the GVI-x product, i.e.
latitude range: [-55.152S to 75.024N], longitude range:[-180W, 180E].
The output array size is huge, [80000 x 28928].
Thus, GVI area is divided into 8 x 8 sub-regions with the same size: [10000 x 3616].
Each sub-region covers 45 degrees in longitude and 16.274 degrees in latitude.
File name example: VGVI.G500m.C01.npp.P2012124_r01c03.nc
where:
| section | meaning |
|---|---|
| VGVI | prefix of file |
| Gxx (or Gxxxm) | resoution in KM (or in meters) |
| C01 | fixed, indicate this is daily map |
| npp | satellite ID |
| Pyyyyddd | year and day of year |
| rxx | row number of GVI sub-region |
| cxx | column number of GVI sub-region |
In each output file of "VIIRS GVI daily map", the following datasets are included:
| variable | SDS name | unit | type | range | scaled | scale_factor |
|---|---|---|---|---|---|---|
| reflectance of image band 1 | reflectance_I1 | NONE | int16 | [0,1] | yes | 0.001 |
| reflectance of image band 2 | reflectance_I2 | NONE | int16 | [0,1] | yes | 0.001 |
| reflectance of MOD band 3 | reflectance_M3 | NONE | int16 | [0,1] | yes | 0.001 |
| brightness temperature of image band 5 | temperature_I5 | K | int16 | [0,400] | yes | 0.1 |
| solar zenith | solar_zenith | degree | int16 | [0,180] | yes | 0.01 |
| sensor zenith | sensor_zenith | degree | int16 | [0,180] | yes | 0.01 |
| solar azimuth | solar_azimuth | degree | int16 | [0,360] | yes | 0.1 |
| sensor azimuth | sensor_azimuth | degree | int16 | [0,360] | yes | 0.1 |
| packed cloud mask | packed_cloud_mask | NONE | int8 |
1. int16: 16 bits integer
2. int8: 8 bits integer
3. scaling formular: value= scale_facor * (scaled_value) +offset (normarlly,offset=0)
"packed cloud mask" dataset contains the following information:
| bit from the least significant bit(LSB) | meaning |
|---|---|
| 0 | invalid(1) / valid(0) |
| 1 | day(1) / night(0) |
| 2 | land(1) / water(0) |
| 3 | coast(1)/ no-coast(0) |
| 4 | glint(1)/ no-glint(0) |
| 5 | snow(1) / no-snow(0) (reserved bit, not set) |
| 6~7 | cloud mask(0~3): clear(0),partial-clear(1),partial-cloudy(2),cloudy(3) |
Quick processing technique:
The range of geo-location and solar zenith angle of each granule is quickly extracted from "GITCO" file by reading the 4 corner pixels only.
By using such granule information, we can skip granules which are out of GVI spatial range or observed in night.