
STAR - Global Vegetation Health Products : High resolution (1km) Vegetation Health Products from VIIRS
High resolution (1 km) Vegetation Health Products from VIIRS for recent years(since 2015) are avalible online.
Note:
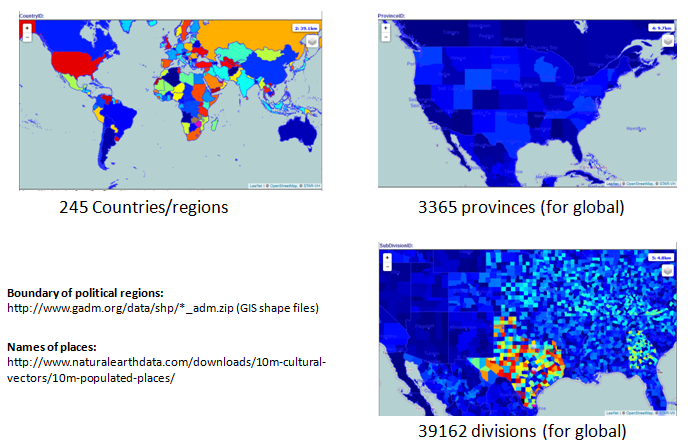
The country/province boundary information was extracted from the web site:
(http://www.gadm.org/world). It was used as it is and there is no warranty
on accurary of political boundary and names.
How to present global image with 1 km resolution by web page
Global vegetation health data with 1 km resolution is very huge, usually have size of 150 to 300 MB per variable. We developed two web pages to bring these images to web users:
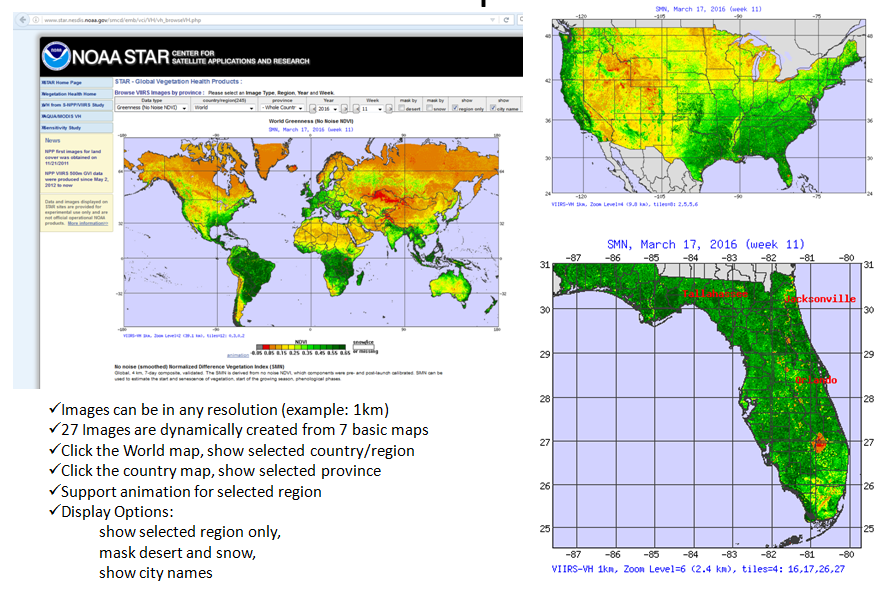
(1) Display the images by plotical regions . World map were presented at begin, user can choose a country or international regions on the world map. For the country map, use can further select a province to see the provincial map. Since these images are dynamically generated, it is optional to apply snow and desert mask, show selected region only and overlay place names.
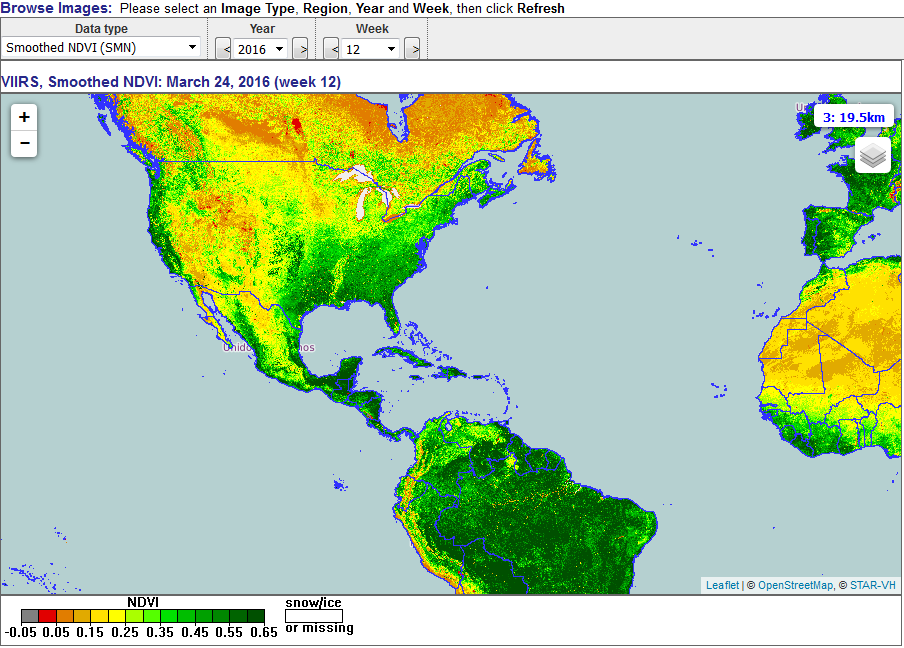
(2) Display the image by leaflet map which works in the same way as "google map". It is easy to zoom in/out and move to desired location.
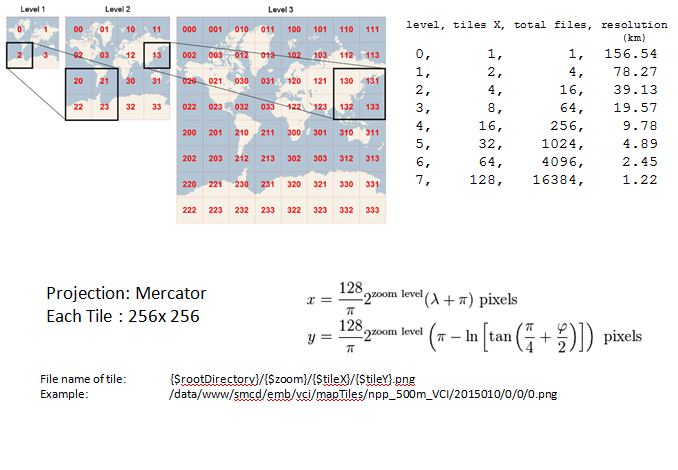
Map tiles
Both web pages require technique of "map tile". Global images are splited into multiple small images for various zoom levels. Map tiles for Vegetation Health products follow the same rules of map tiles for "open street map", which are in Mercator projection, each tile has size 256 x 256 pixels. For 1 km resolution dataset, map tiles from zoom level 0 to 7 are required. A web page usually displays a very small portion of a global image. When requested portion covers a big spatial area, tiles from a low zoom level will be used; if detail is required, we need image tiles at a higher zoom level. Each time, only a few tiles are returned to web browser, and then they are put together and composed the required image.
Although the leaflet map provides a friendly method to browse vegetation health images overlaid with other information, it requires all map tiles for each layer are pre-created, and it is hard to present a derived variable on leaflet.
The image for a political region are also derived from these pre-created map tiles. By using the technique of dynamic image, the returned image may be composed from images of basic variables. For example, we can calculate the drought change from last year from the basic VH maps. This avoids saving the drived image of "drought change from last year" on disk. So far, there are only 7 basic variables for VH, and 27 derived variables.
Ancillary data used for VH products
Map tiles for the following ancillary data were required to support above web pages:
- ID of country, province and divison : generated from GIS shape file for adminstrative boundary, Level 0,1 and 2 respectively
- Boundary for GIS level 0,1 and 2
- IGBP land type: generated from USGS Global Land Cover Characteristics Data Base Version 2.0
- Elevation: Global Land One-kilometer Base Elevation (GLOBE)

Map Tiles for basic weekly products
map tiles for the following variables were generated on weekly basis.
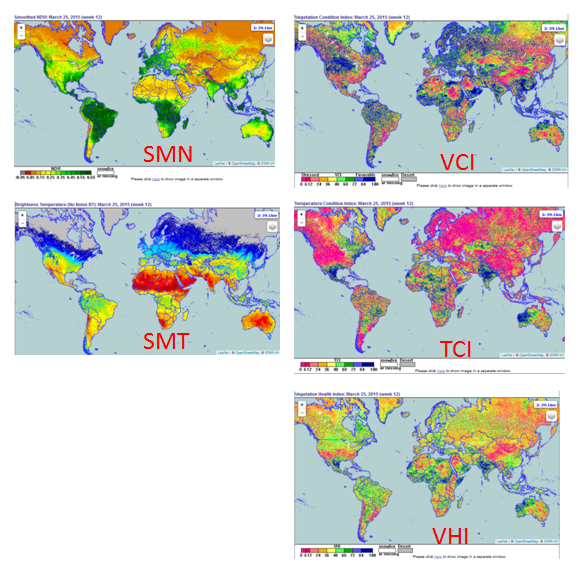
- SMN, SMT
- VCT, TCI, VHI
- Rain rate, Snow
Procedure to dynamically create regional images from Map Tiles of basic weekly products
- Get the zoom level and XY range,
- Get the required tiles
- Calculate derived product
- Create new image, set colors by the derived product
- Apply mask of snow
- Apply mask of desert
- Apply mask of the selected region
- Add boundary
- Add grid and labels
- Add city names