
STAR - Global Vegetation Health Products: Monitoring Quality of VHP Products
Statisticc information was generated for each VHP product file and
saved as META data file in standard XML format. Here is an exmaple META data file:
VHP.G04.C07.NC.P1982001.ND.META.xml
The quality of VHP product can be monitored by the statistic information stored in META data file.
The picture below visualized the content of META data, it may help visually evaluate quality of VHP product.
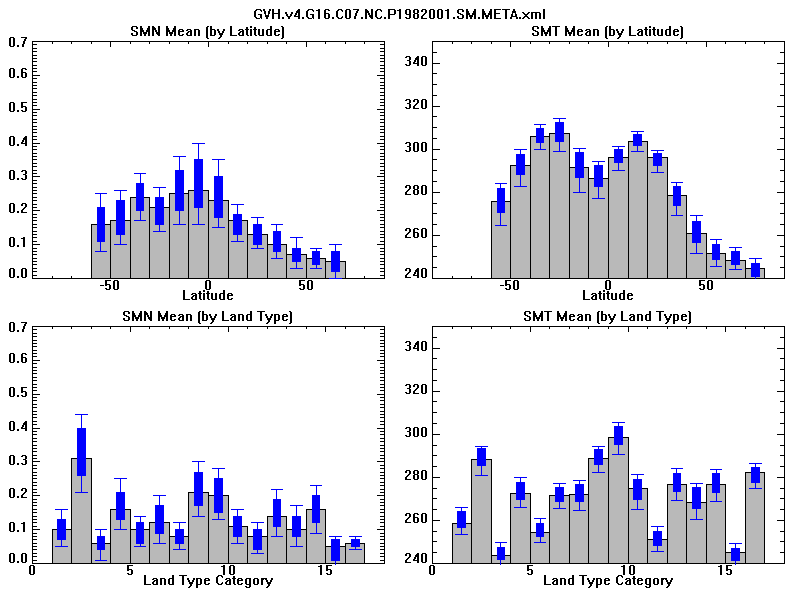
This plot compared the mean SMN and SMT of a particular week against the climatology.
Grey boxes are mean values of SMN and SMT of week 1 ,1982, averaged by latitude zone or by land type. The centers of blue boxes are the corresponding mean values of the climatology of week 1 , the length of blue box are 2 * standard deviation, and thin blue lines indicate the max and min value of climatology.
If the value is out of the blue boxes and lines, there are some problems for the product.
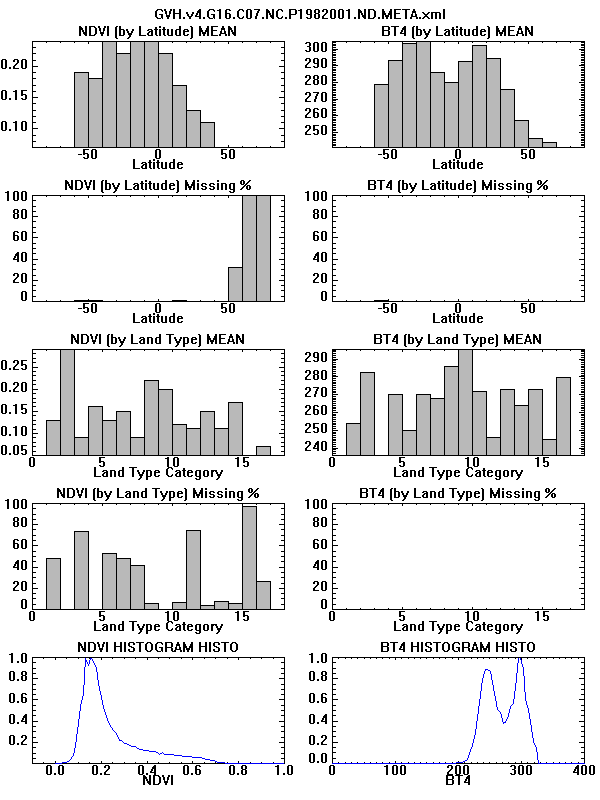
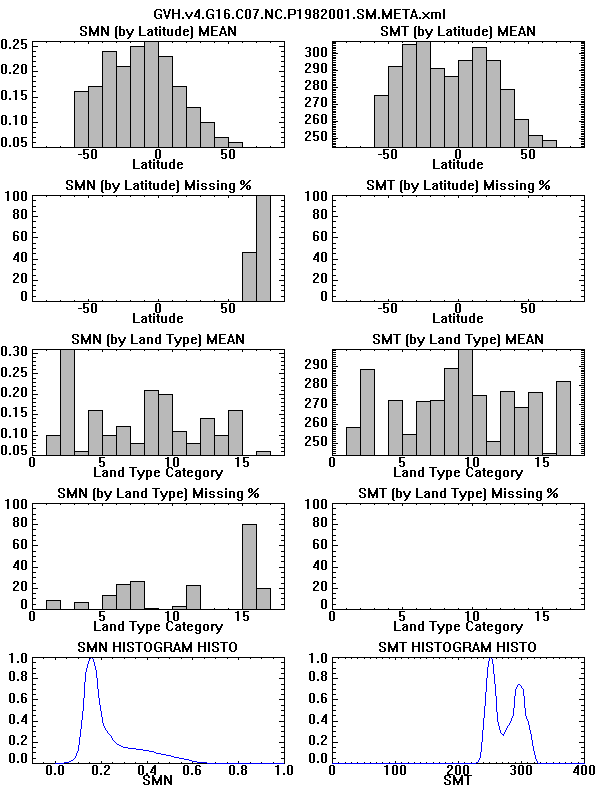
The mean value and missing data percentage for NDVI and BT (left), SMN and SMT (right).
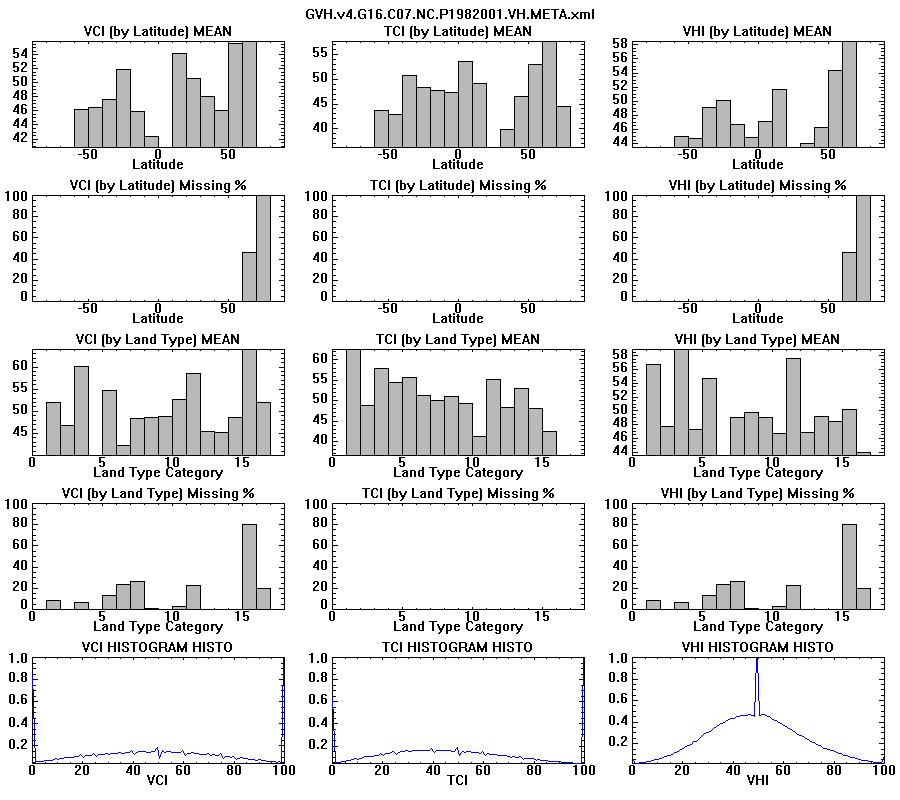
The mean value and missing data percentage for VCI/TCI/VHI.