
Python Script Tutorial: Download TROPOMI Level 2 Data Files from the S5P Data Hub
TROPOMI Level 2 data files are freely available from the Sentinel 5-Precursor (S5P) Pre-Operations Data Hub.
Using Jupyter Notebook format, this tutorial demonstrates how to:
- Enter parameters to search for TROPOMI Level 2 data files on the S5P Data Hub for a range of observation days, in a domain of interest, including:
- Data product (AI, ALH, CO, HCHO, NO2, or SO2)
- Data processing latency (near real-time, offline, or reprocessing)
- Observation range start date
- Observation range end date
- Latitude/longitude boundaries for search domain:
- Western-most longitude
- Eastern-most longitude
- Southern-most latitude
- Northern-most latitude
- Query S5P Data Hub for available files matching the user-entered search parameters
- Download the available data files to the user's local computer/server
Please acknowledge the NOAA/NESDIS/STAR Aerosols and Atmospheric Composition Science Team if using any of this code in your work/research!
Import Python packages
The first step is to import all of the Python packages we need for the entire script. We will use the Sentinelsat library to access the S5P Data Hub using guest credentials.
# Import Python packages

# Module to connect to the Copernicus Open Access Hubs
from sentinelsat import SentinelAPI

# Module for manipulating dates and times
import datetime

# Module to set filesystem paths appropriate for user's operating system
from pathlib import Path

# Modules to create interactive menus in Jupyter Notebook
from IPython.display import display
import ipywidgets as widgets
Enter search parameters using Jupyter Widgets menus
We need a way for the user to enter the parameters for their data search. In Jupyter Notebook, we can use Jupyter widgets to make user-friendly GUI menus for entering search variables.
First, run this code block to generate the interactive menus. Then, use the menus to select the TROPOMI product, data latency, observation year/month/day range, and latitude/longitude domain boundaries for the file search. The search parameters are input to the rest of the script from the menus via the main function, by reading the ".value" of each menu variable.
It is only necessary to run the widgets code block once to generate the menus. Subsequently, selections in the menus can be changed, and multiple consecutive file searches can be run via the main function, without re-running this widgets code. If this code block is re-run, it will reset all the menus to their default values, and the user will need to re-select the search parameters of interest again before running the main function.
# Enter product, data latency, observation start/end dates and domain boundaries for file search
# Selections are made using interactive Jupyter Notebook widgets
# Run this block *once* to generate menus
# When main function is run, it reads ".value" of each menu selection
# Do NOT re-run block if you change menu selections (re-running block resets menus to defaults)!

# Formatting settings for drop-down menus
style = {'description_width':'140px'}
layout = widgets.Layout(width='300px')

# Create drop-down menus using widgets
product = widgets.Dropdown(options=[('Aerosol Index', 'AI'), ('Aerosol Layer Height', 'ALH'), ('Carbon Monoxide', 'CO'), ('Formaldehyde', 'HCHO'), ('Nitrogen Dioxide', 'NO2'), ('Sulfur Dioxide', 'SO2')], description='Product:', style=style, layout=layout)
latency = widgets.Dropdown(options=[('Near real time'), ('Offline'), ('Reprocessing') ], description='Data Latency:', style=style, layout=layout)
start_year = widgets.Dropdown(options=[('2018'), ('2019'), ('2020'), ('2021'), ('2022'), ('2023'), ('2024')], description='Start Year:', style=style, layout=layout)
start_month = widgets.Dropdown(options=[('Jan', '01'), ('Feb', '02'), ('Mar', '03'), ('Apr', '04'), ('May', '05'), ('Jun', '06'), ('Jul', '07'), ('Aug', '08'), ('Sep', '09'), ('Oct', '10'), ('Nov', '11'), ('Dec', '12')], description='Start Month:', style=style, layout=layout)
start_day = widgets.Dropdown(options=[('01'), ('02'), ('03'), ('04'), ('05'), ('06'), ('07'), ('08'), ('09'), ('10'), ('11'), ('12'), ('13'), ('14'), ('15'), ('16'), ('17'), ('18'), ('19'), ('20'), ('21'), ('22'), ('23'), ('24'), ('25'), ('26'), ('27'), ('28'), ('29'), ('30'), ('31')], description='Start Day:', style=style, layout=layout)
end_year = widgets.Dropdown(options=[('2018'), ('2019'), ('2020'), ('2021'), ('2022'), ('2023'), ('2024')], description='End Year:', style=style, layout=layout)
end_month = widgets.Dropdown(options=[('Jan', '01'), ('Feb', '02'), ('Mar', '03'), ('Apr', '04'), ('May', '05'), ('Jun', '06'), ('Jul', '07'), ('Aug', '08'), ('Sep', '09'), ('Oct', '10'), ('Nov', '11'), ('Dec', '12')], description='End Month:', style=style, layout=layout)
end_day = widgets.Dropdown(options=[('01'), ('02'), ('03'), ('04'), ('05'), ('06'), ('07'), ('08'), ('09'), ('10'), ('11'), ('12'), ('13'), ('14'), ('15'), ('16'), ('17'), ('18'), ('19'), ('20'), ('21'), ('22'), ('23'), ('24'), ('25'), ('26'), ('27'), ('28'), ('29'), ('30'), ('31')], description='End Day:', style=style, layout=layout)

# Caption for map domain boundaries
domain_caption = widgets.Label(value='ENTER LATITUDE/LONGITUDE BOUNDARIES FOR SEARCH AREA (use up/down arrows or type in value)', layout=widgets.Layout(height='30px'))

# Format observation start/end dates menus to display side-by-side
start_date = widgets.HBox([start_year, start_month, start_day])
end_date = widgets.HBox([end_year, end_month, end_day])

# Create numerical (float) text entry widgets for map boundary corners
west_lon_float = widgets.BoundedFloatText(description='Western-most Longitude:', value=0, min=-180, max=180, disabled=False, layout=widgets.Layout(width='250px', height='30px'), style={'description_width':'150px'})
east_lon_float = widgets.BoundedFloatText(description='Eastern-most Longitude:', value=0, min=-180, max=180, disabled=False, layout=widgets.Layout(width='250px', height='30px'), style={'description_width':'150px'})
lon_label = widgets.Label(value='(use negative values to indicate °W, e.g., 100 °W = -100)', layout=widgets.Layout(width='400px'))
lon_box = widgets.HBox([west_lon_float, east_lon_float, lon_label])
north_lat_float = widgets.BoundedFloatText(description='Northern-most Latitude:', value=0, min=-90, max=90, disabled=False, layout=widgets.Layout(width='400px', height='30px'), style={'description_width':'300px'})
south_lat_float = widgets.BoundedFloatText(description='Southern-most Latitude:', value=0, min=-90, max=90, disabled=False, layout=widgets.Layout(width='400px', height='30px'), style={'description_width':'300px'})
lat_label = widgets.Label(value='(use negative values to indicate °S, e.g., 30 °S = -30)', layout=widgets.Layout(width='400px'))
north_lat_box = widgets.HBox([north_lat_float, lat_label])
south_lat_box = widgets.HBox([south_lat_float, lat_label])

# Display drop-down menus
print('If you change menu selections (e.g., to run another search), do NOT re-run this block!\nRe-running will re-set all menus to their defaults!')
display(product, latency)
display(start_date, end_date)
display(domain_caption, north_lat_box, lon_box, south_lat_box)
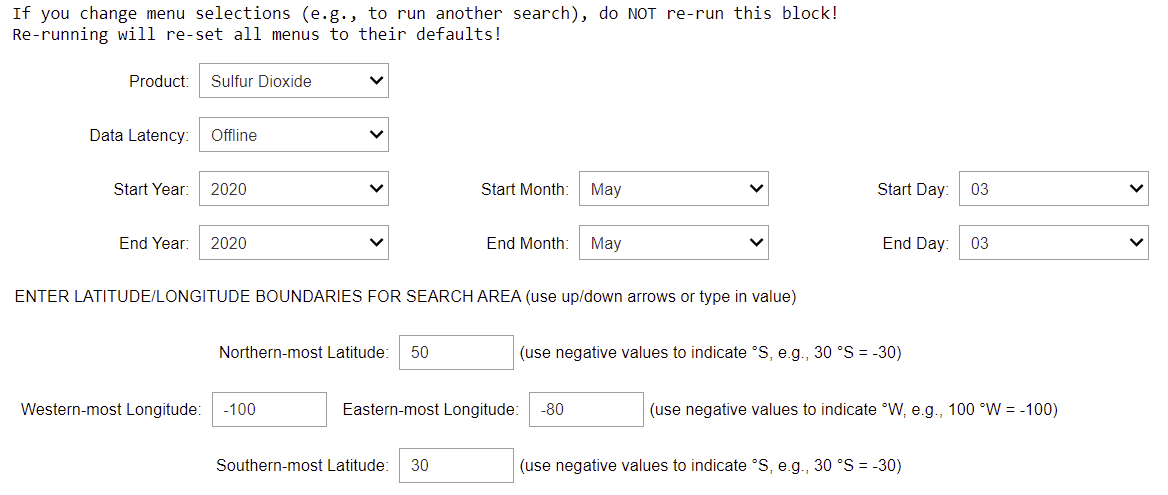
The image below shows a screenshot of the output GUI, with the pull-down menus set to search for SO2 data with "offline" processing latency on May 3, 2020 for the region bounded by 100 to 80 °W longitude and 30 to 50 °N latitude (click image to open full-size version).
Function to convert format of user-entered observation dates
The Sentinel API requires the observation period start and end dates be entered as 8-digit strings, with a single dash separating the year from the month and the month the day: "YYYY-MM-DD".
We create a function called "convert_date_sentinel_api_format( )" that takes the year, month, and day entered in the widget menus and converts them into the formatted date required by the Sentinel API.
# Convert user-entered date format to that used by Sentinel API
# "year", "month", "day": parameter variables from widget menu, set in main function

def convert_date_sentinel_api_format(year, month, day):

    # Add dashes b/w year/month and month/day
    formatted_date = year + '-' + month + '-' + day

    return formatted_date
Function to get TROPOMI Level 2 file name product abbreviation
TROPOMI Level 2 file names include an abbreviation for the Level 2 product. We create a function, called "get_tropomi_product_abbreviation( )", that returns the abbreviation corresponding to the user-entered product. We will use this abbreviation in our query to the S5P Data Hub.
# Get product abbrevation used in TROPOMI file name
# "product": parameter variable from widget menu, set in main function

def get_tropomi_product_abbreviation(product):
    if product == 'CO':
        product_abbreviation = 'L2__CO____'
    elif product == 'NO2':
        product_abbreviation = 'L2__NO2___'
    elif product == 'SO2':
        product_abbreviation = 'L2__SO2___'
    elif product == 'HCHO':
        product_abbreviation = 'L2__HCHO__'
    elif product == 'AI':
        product_abbreviation = 'L2__AER_AI'
    elif product == 'ALH':
        product_abbreviation = 'L2__AER_LH'

    return product_abbreviation
Function to create list of available TROPOMI data file names
We create a function, called "tropomi_list_files( )", that returns a list of the available TROPOMI Level 2 data file names matching the user-entered product, latency, observation date period, and search area. There are multiple steps in this function.
First, we access the S5P Data Hub using the "Sentinelsat" library. We use guest login credentials, which are "s5pguest" for both the ID and password.
Next, we define the "footprint" polygon search area, by setting the corners of the search box using the latitude and longitude boundaries entered via the widget menus. Then we "query" the Sentinel API to find available data file information ("products") matching the specified TROPOMI product, data processing latency, search area, and start-end date range.
The "Sentinelsat" library includes a command to output the results of the search query to a "Pandas" library dataframe ("products_df"). This puts the results of the search in a format that is easy to manipulate.
The last step is to extract the file names to a list called "file_name_list" and the file sizes to a list called "file_size_list".
# Create list of TROPOMI data file names for user-entered product, latency, search region, and date range
# "product_abbreviation": parameter variable from "get_tropomi_product_abbreviation(product)" function
# "start_date", "end_date": parameter variables from "convert_date_sentinel_api_format(year, month, day)" function
# "west_lon", "east_lon", "south_lat", "north_lat", "latency": parameter variables from widget menus, set in main function

def tropomi_list_files(west_lon, east_lon, south_lat, north_lat, start_date, end_date, product_abbreviation, latency):

    # Access S5P Data Hub using guest login credentials
    api = SentinelAPI('s5pguest', 's5pguest', 'https://s5phub.copernicus.eu/dhus')

    # Query API for specified region, start/end dates, data product
    footprint = 'POLYGON((' + west_lon + ' ' + south_lat + ',' + east_lon + ' ' + south_lat + ',' + east_lon + ' ' + north_lat + ',' + west_lon + ' ' + north_lat + ',' + west_lon + ' ' + south_lat + '))'
    try:
        products = api.query(area=footprint, date=(start_date + 'T00:00:00Z', end_date + 'T23:59:59Z'), producttype=product_abbreviation, processingmode=latency)
    except:
        print('Error connecting to SciHub server. This happens periodically. Run code again.')

    # Convert query output to pandas dataframe (df) (part of Sentinelsat library)
    products_df = api.to_dataframe(products)

    # Extract data file names from dataframe to list
    if len(products_df) > 0:
        file_name_list = products_df['filename'].tolist()
        file_size_list = products_df['size'].tolist()
    else:
        file_name_list = []
        file_size_list = []

    return file_name_list, file_size_list, products
Function to download TROPOMI data files
We create a function, called "tropomi_download_files( )", that takes as an argument the "products" query result from the Sentinel API that we obtained using the "tropomi_list_files( )" function. We use the ".download_all( )" command to download all of the data files found in the "products" query.
The "Sentinelsat" library includes the tqdm library, which will automatically display a progress bar for each file that is downloaded. The progress bar shows the full file name, percent complete of the file download, the bytes downloaded and the total file size, the total time elapsed/remaining in the download, and the approximate speed of the download.
# Download TROPOMI data files
# "save_path": parameter variable set in main function
# "products": parameter variable from "tropomi_list_files( )" function

def tropomi_download_files(products, save_path):

    # Query S5P Data Hub using guest login credentials
    api = SentinelAPI('s5pguest', 's5pguest', 'https://s5phub.copernicus.eu/dhus')

    # Download data files to specified subdirectory
    # Note: Sentinelsat library includes tqdm download progress bar
    try:
        api.download_all(products, save_path)
    except KeyboardInterrupt:
        print('\nDownload was interrupted by user.')
Function to print available data file names, with option to download files
We create a function, called "get_tropomi_files( )", that first prints the search results, including the list of available files/sizes and the name of the directory where downloaded files will be saved. Then we ask the user if they want to download the files ("yes/no"). This allows the user to review the results of the search, as well as the destination directory, before initiating the download. If there are any problems with the search results, for example if the wrong product was selected by mistake, the user can answer "no" to terminate the script, and then adjust the search parameters in the GUI pull-down menus and re-run the script via the main function.
If the user enters "yes" to download the files, we call the "tropomi_download_files( )" function, which will download the available data files to the designated directory on the user's local computer/server.
# Print available TROPOMI data files that match user specifications, with option to download files
# "save_path": parameter variable set in main function
# "product_abbreviation": parameter variable from "get_tropomi_product_abbreviation(product)" function
# "start_date", "end_date": parameter variables from "convert_date_sentinel_api_format(date)" function
# "west_lon", "south_lat", "east_lon", "north_lat", "latency": parameter variables from widget menus, set in main function

def get_tropomi_files(west_lon, east_lon, south_lat, north_lat, start_date, end_date, product_abbreviation, latency, save_path):

    # Query S5P Data Hub and list file names matching user-entered info
    file_name_list, file_size_list, products = tropomi_list_files(west_lon, east_lon, south_lat, north_lat, start_date, end_date, product_abbreviation, latency)

    # Print list of available file names/sizes
    if len(file_name_list) > 0:
        print('\nList of available data files (file size):')
        for file, size in zip(file_name_list, file_size_list):
            print(file, ' (', size, ')', sep='')

        # Print directory where files will be saved
        print('\nData files will be saved to:', save_path)

        # Ask user if they want to download the available data files
        # If yes, download files to specified directory
        download_question = 'Would you like to download the ' + str(len(file_name_list)) + ' files?\nType "yes" or "no" and hit "Enter"\n'
        ask_download = input(download_question)
        if ask_download in ['yes', 'YES', 'Yes', 'y', 'Y']:
            tropomi_download_files(products, save_path)
        else:
            print('\nFiles are not being downloaded.')
    else:
        print('\nNo files retrieved.  Check settings and try again.')
Main function: execute script
The main function executes the script by calling the "get_tropomi_files( )" function we created. Prior to that, we enter the directory where downloaded files will be saved ("save_path"). For simplicity, we set the directory as the current working directory, but this could be replaced by a user-entered directory path; we recommend using the pathlib module to set filesystem paths.
We obtain the S5P Data Hub search variables, entered in the widget menus, by reading ".value" for each of the widget menu variables. We convert the user-entered observation range start year/month day and end year/month/day to "start_date" "end_date", respectively, in the format needed by the Sentinel API, using the "convert_date_sentinel_api_format( )" function we created.
We also need to convert the latitude and longitude values, entered as floating point numbers ("floats") via the widget menus, to string format, which is required by the Sentinel API.
Note that we didn't include any error checks in this script, for simplicity. But users may want to add error checks to ensure the entered observation end date is not prior to the start date, and that the end date is not in the future.
# Execute search to find available TROPOMI L2 data files, with option to download files
# Get values from widget menus (search parameters) using ".value"

# Main function
if __name__ == '__main__':

    # Set directory to save downloaded files (as pathlib.Path object)
    # Use current working directory for simplicity
    save_path = Path.cwd()

    # Get TROPOMI product abbreviation used in file name
    product_abbreviation = get_tropomi_product_abbreviation(product.value)

    # Change user-entered observation year/month/day for observation period to format used by Sentinel API
    start_date = convert_date_sentinel_api_format(start_year.value, start_month.value, start_day.value)
    end_date = convert_date_sentinel_api_format(end_year.value, end_month.value, end_day.value)

    # Convert latitude/longitude values entered as floats to string format used by Sentinel API
    west_lon = str(west_lon_float.value)
    east_lon = str(east_lon_float.value)
    south_lat = str(south_lat_float.value)
    north_lat = str(north_lat_float.value)

    # Execute script
    get_tropomi_files(west_lon, east_lon, south_lat, north_lat, start_date, end_date, product_abbreviation, latency.value, save_path)
Example of output from search for SO2 data files with "offline" processing latency on May 3, 2020 for the region bounded by 100 to 80 °W longitude and 30 to 50 °N latitude:
List of available data files (file size):
S5P_OFFL_L2__SO2____20200503T193436_20200503T211606_13243_01_010108_20200505T215751.nc (884.76 MB)
S5P_OFFL_L2__SO2____20200503T175306_20200503T193436_13242_01_010108_20200505T203440.nc (925.31 MB)
S5P_OFFL_L2__SO2____20200503T161136_20200503T175306_13241_01_010108_20200505T185430.nc (919.66 MB)

Data files will be saved to: C:\Users\Trainings\Website
Would you like to download the data files?
Type "yes" or "no" and hit "Enter"
yes

Downloading products: 100%|█████████████████████████| 3/3 [06:24<00:00, 360s/product]
Downloading S5P_OFFL_L2__SO2____20200503T193436_20200503T211606_13243_01_010108_20200505T215751.nc:
100%|█████████████████████████| 928M/928M [06:24<00:00, 3.29MB/s]
Downloading S5P_OFFL_L2__SO2____20200503T161136_20200503T175306_13241_01_010108_20200505T185430.nc:
100%|█████████████████████████| 964M/964M [05:25<00:00, 3.62MB/s]
Downloading S5P_OFFL_L2__SO2____20200503T175306_20200503T193436_13242_01_010108_20200505T203440.nc:
100%|█████████████████████████| 970M/970M [05:18<00:00, 3.49MB/s]