Satellite Data Processing Levels
Level 1b (L1b) Data
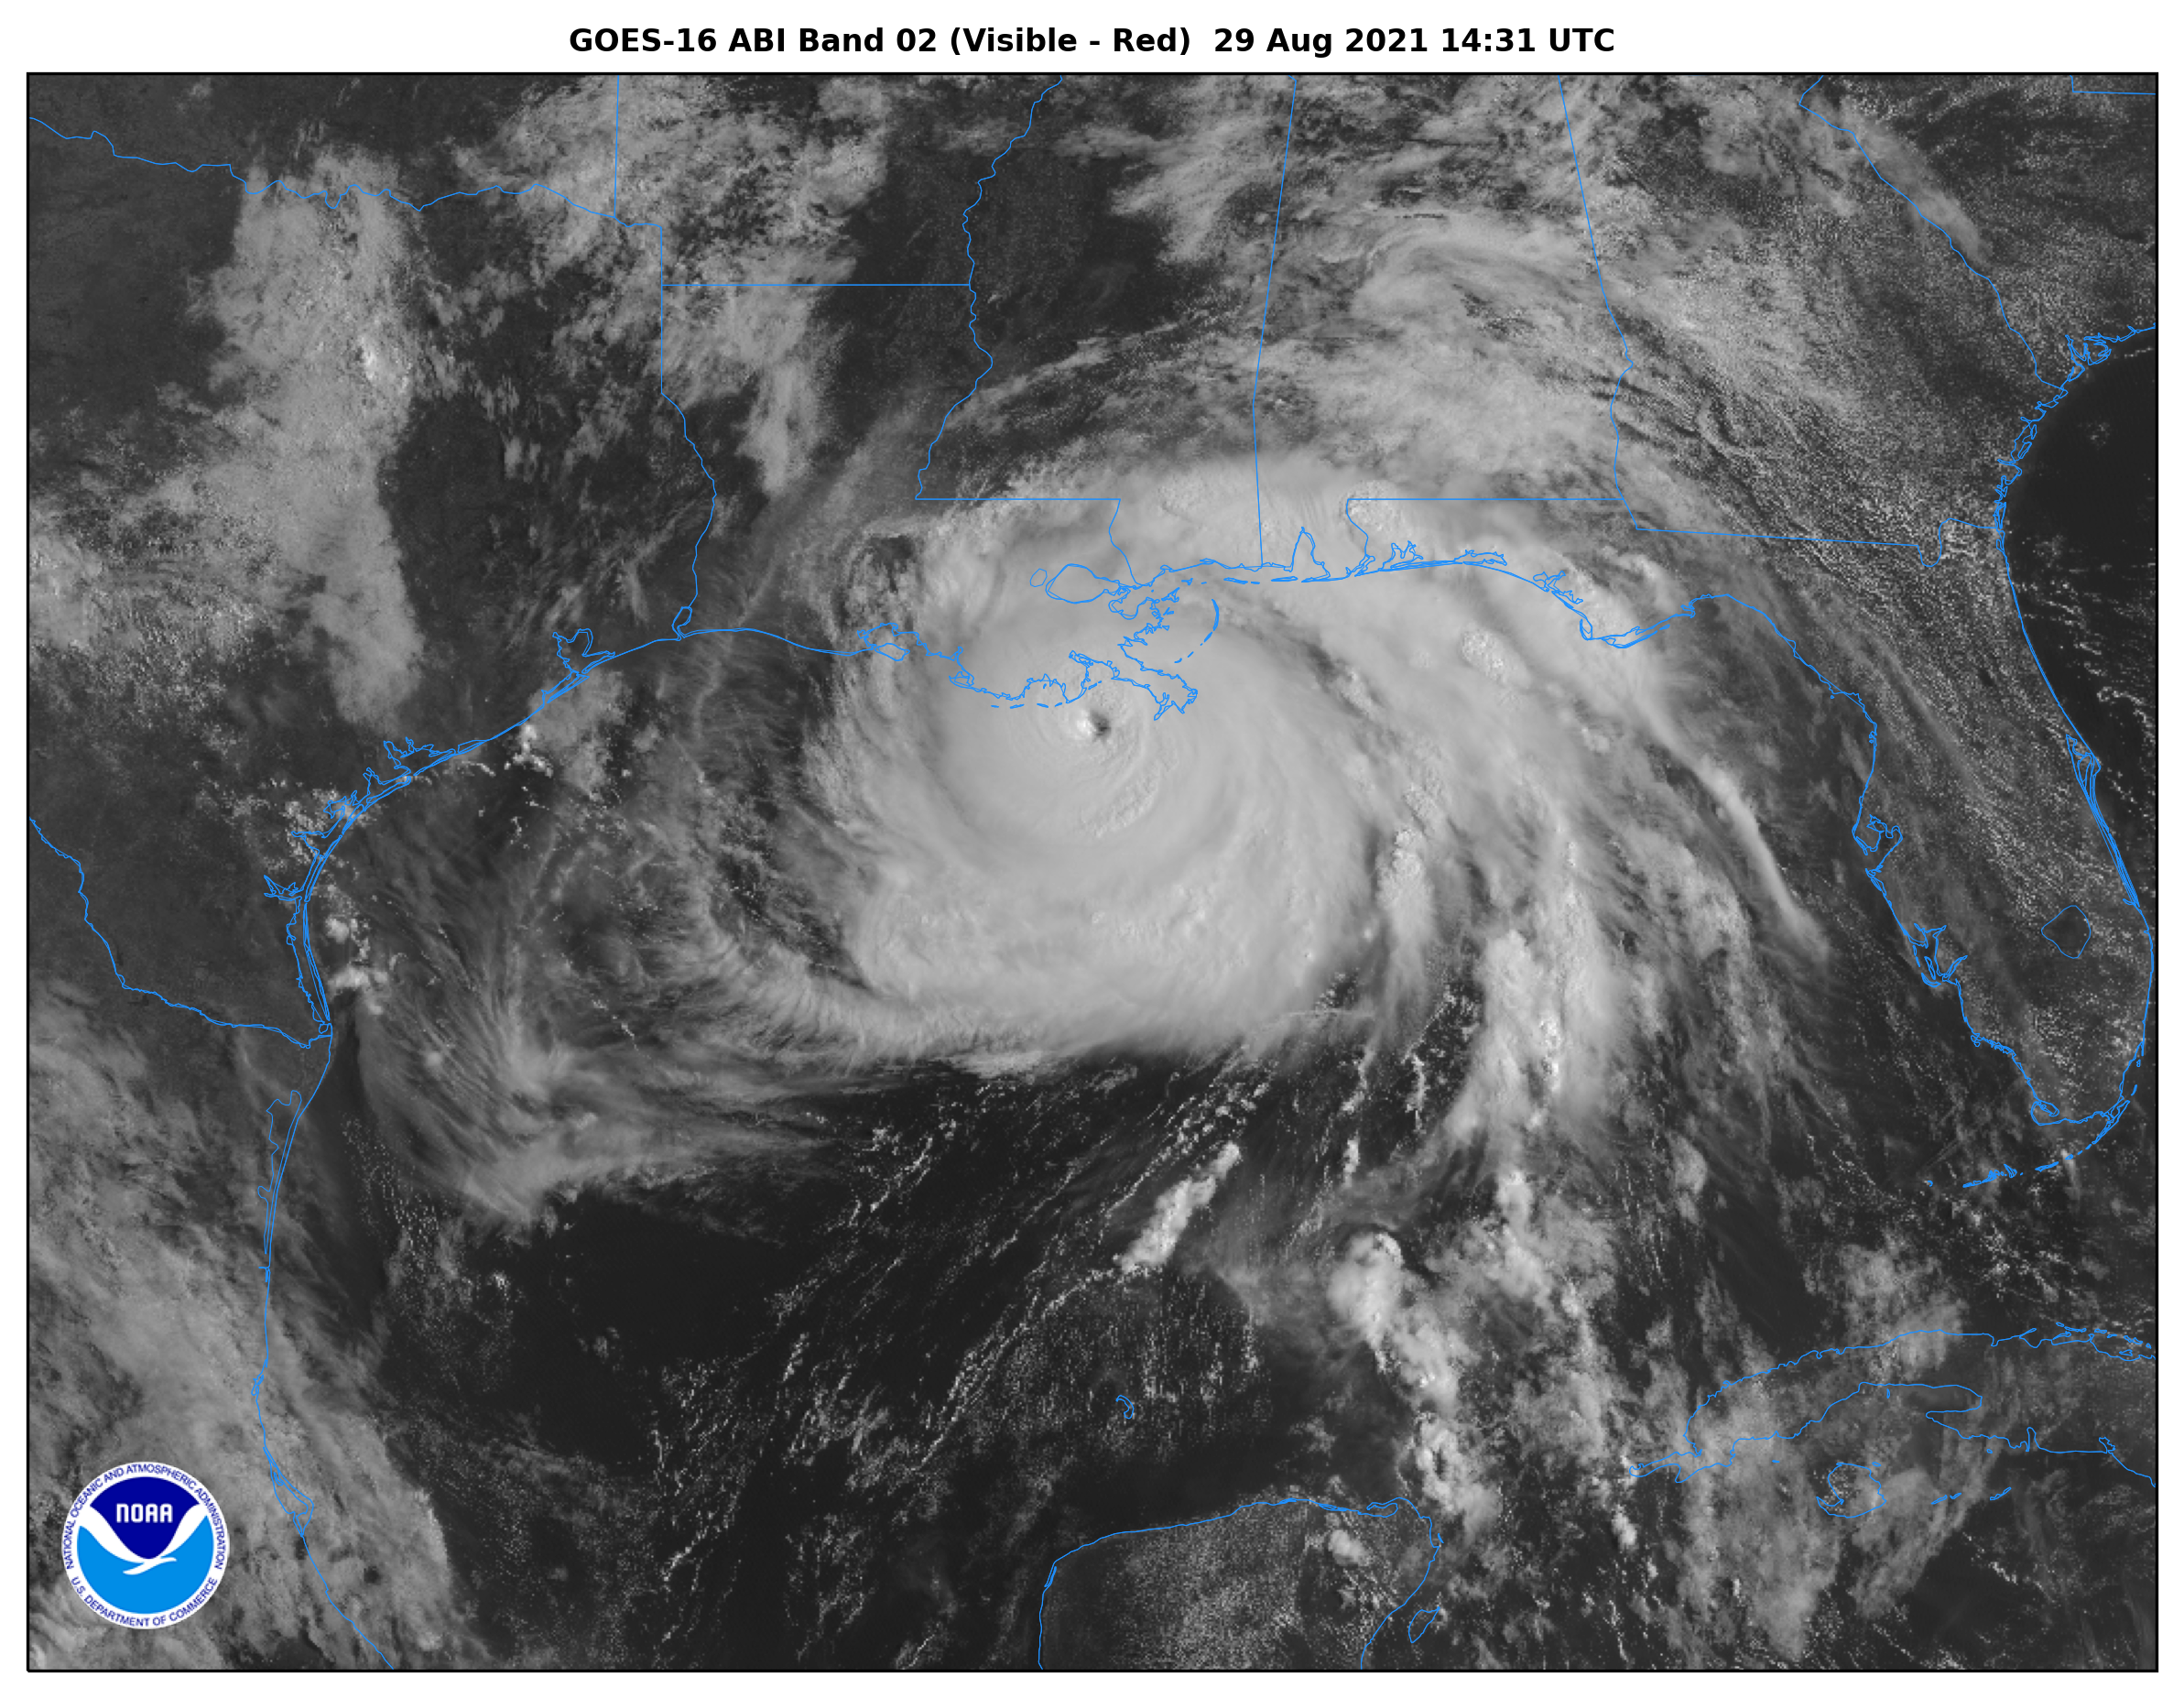
Satellite sensors measure electromagnetic radiation at specific wavelengths. These measurements, called radiances, can be utilized directly to make observations about the atmosphere, land, or oceans. Radiances measured by a satellite sensor that have been calibrated and geo-located are called Level 1b data. For example, a meteorologist might use Level 1b visible wavelength imgery to monitor cloud formation associated with a tropical cyclone.
GOES-East ABI Band 2 (visible) Level 1b imagery of Hurricane Ida’s landfall on August 29, 2021 is shown below (click image to open full size version).
Level 2 (L2) Data
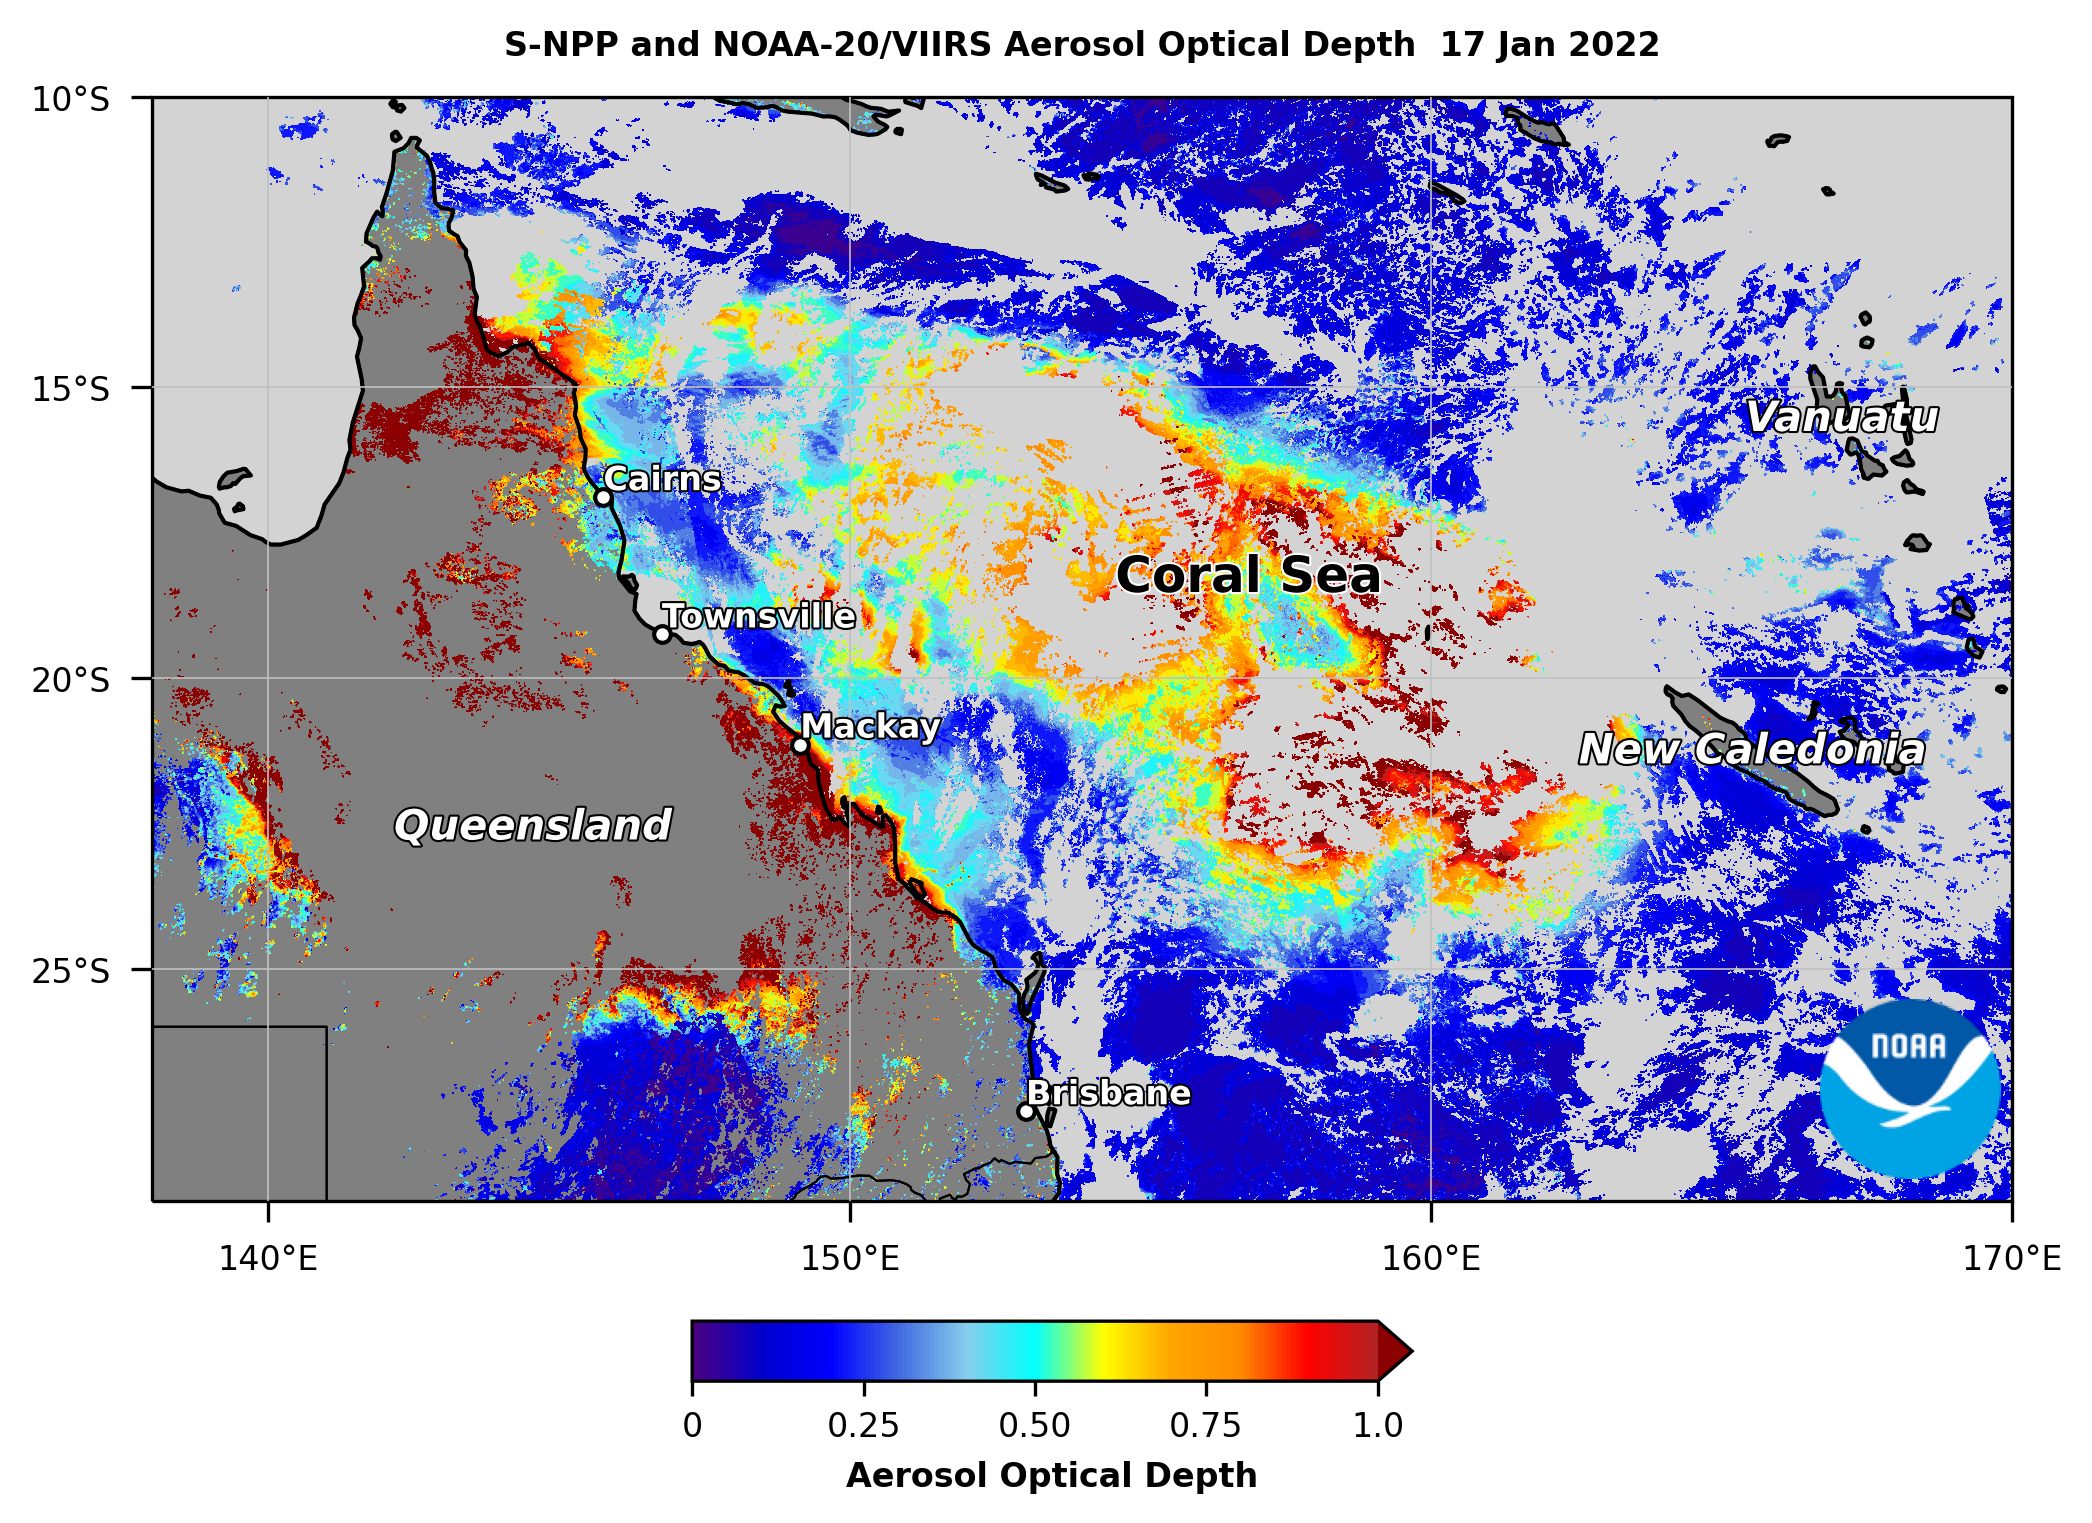
Level 1b data are used in scientific algorithms to derive geophysical parameters, which are termed Level 2 data. An algorithm is a step-by-step procedure or formula used to obtain a specific result. Level 2 data have the same spatial resolution and observation frequency as their Level 1b source data. Most of the products featured in our training courses are Level 2.
Level 2 SNPP & NOAA-20 VIIRS AOD imagery of volcanic aerosols over eastern Australia and the Coral Sea, transported from the eruption of Hunga Tonga-Hunga Ha‘apai on January 15, 2022, is shown below (click image to open full size version).
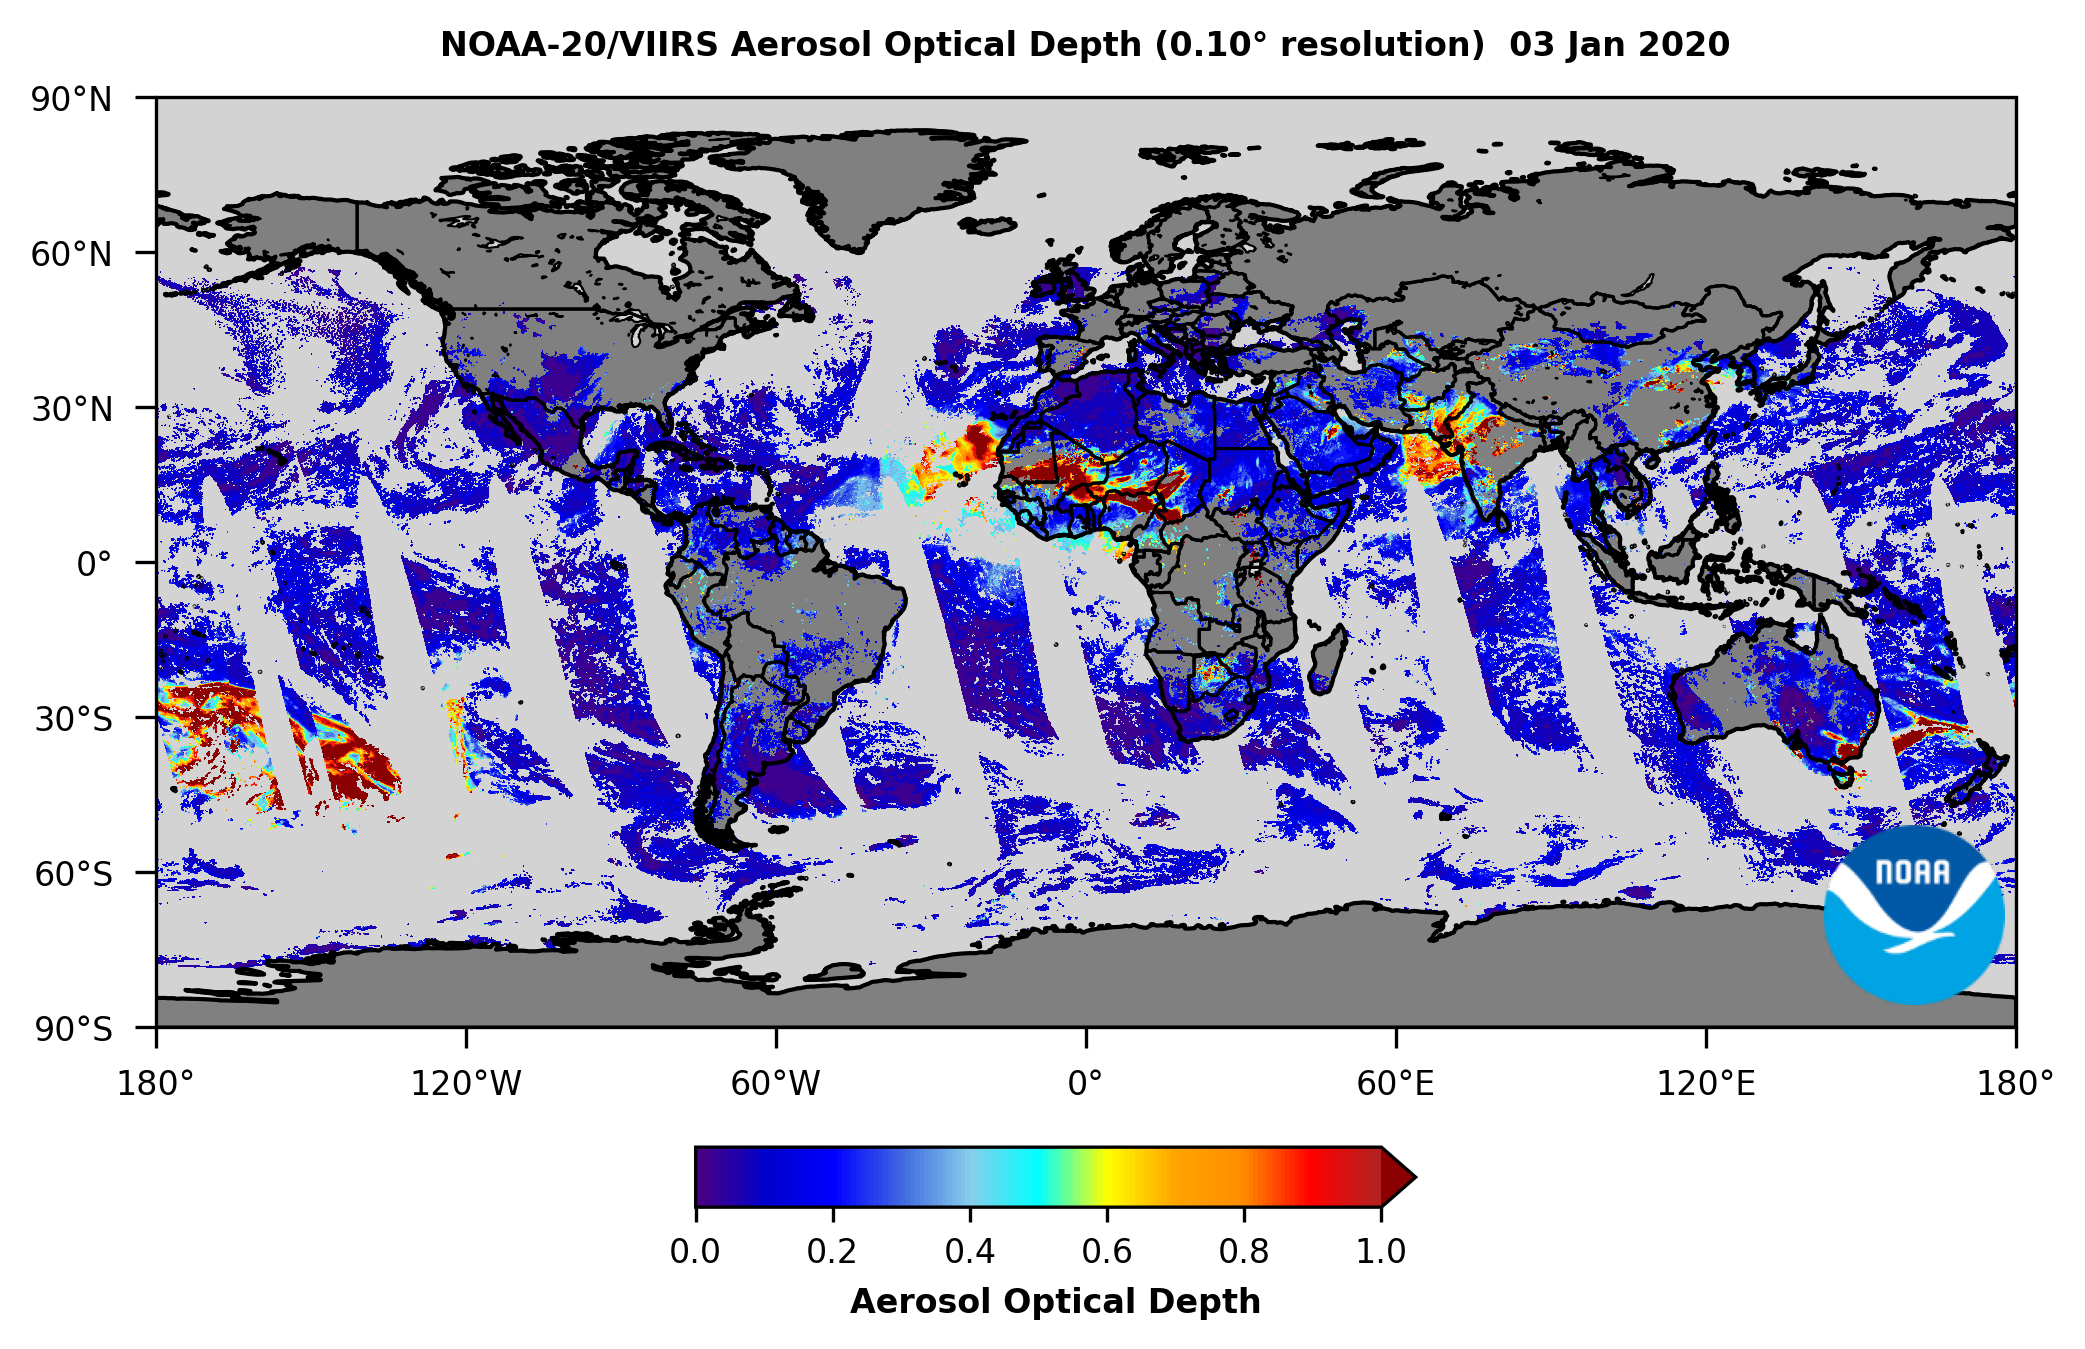
Level 3 (L3) Data
Level 3 data are Level 2 data that have been mapped on a uniform space-time grid, and thus have been averaged over space and/or time. For example, the VIIRS Level 3 AOD product is a gridded composite at 0.1° or 0.25° resolution, available daily or as a monthly average; it is derived from the daily 750 m resolution Level 2 AOD data.
Level 3 NOAA-20 VIIRS AOD imagery at 0.1° resolution for January 3, 2020 is shown below (click image to open full size version).