
MIRS Caught The Strong Temperature Swing Over North America
January 19, 2018
January 19, 2018
The latest NOAA operational polar orbiting satellite JPSS-1 (NOAA-20) was launched into Earth orbit on November 18, 2017, and began to send back its first Advanced Technology Microwave Sounder (ATMS) science data on November 29, 2017. The NOAA-20 satellite carries five instruments that will improve day-to-day weather forecasting while extending the record of many long-term observations of Earth's climate.
ATMS receives 22 channels of radio waves from 23 to 183 gigahertz (GHz). Five water vapor channels, combined with other temperature sounding channels are used to provide the critical global atmospheric temperature and water vapor needed to provide accurate weather forecasts out to seven days. ATMS also maps global precipitation, snow and ice cover.
The Microwave Integrated Retrieval System (MiRS) is the official operational microwave-only satellite retrieval system for NOAA and is now running experimentally on NOAA-20 ATMS data until it is declared operational later this year. It produces maps of temperature, water vapor, precipitation, snow and ice cover each day. The products from MiRS are preliminary, and non-operational.
|
|
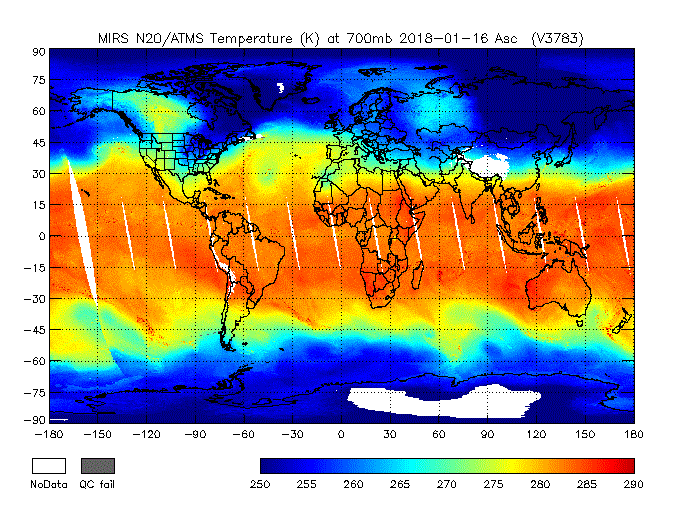
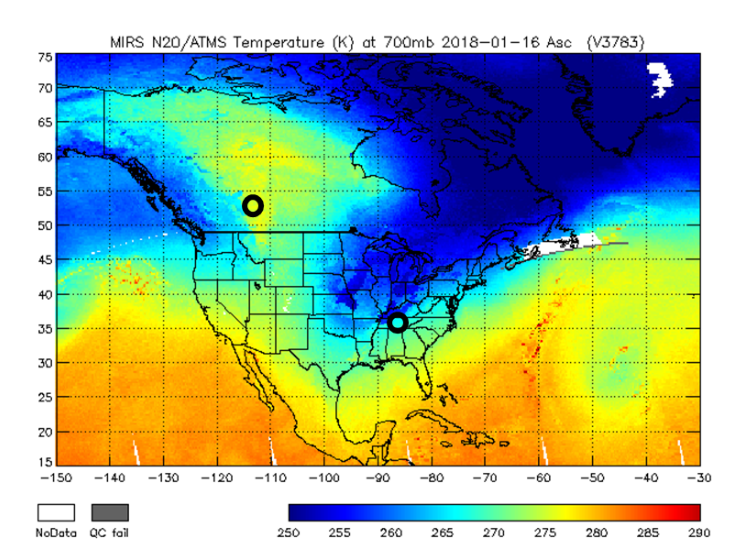
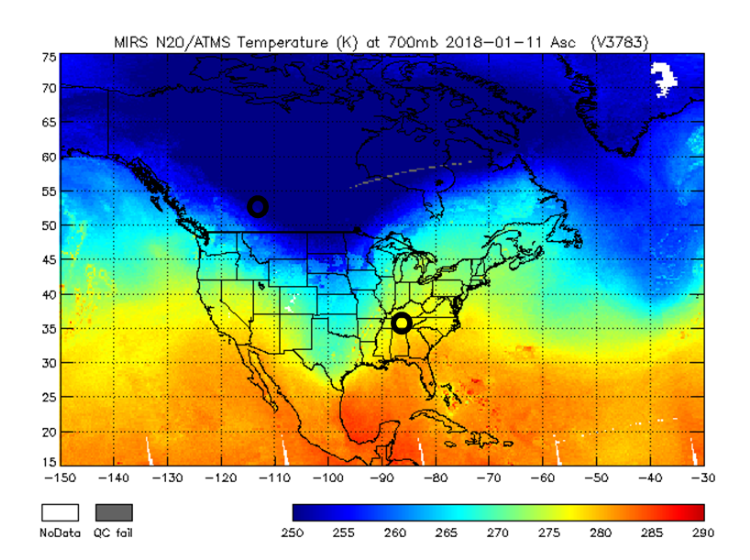
The first image shown is a map of atmospheric temperature at 700 millibars, approximately 3000 meters (10,000 feet), over the globe on January 16, 2018. The next two images shown side by side are the 700 mb temperature over North America on both January 16 (left) and January 11 (right), 2018. The most notable feature on January 16 over North America is the contrast between the extremely warm temperatures in northwestern Canada with the extreme cold, associated with a sharp dip in the jet stream over the US Midwest. The difference in temperature between the two features is more than 30 degrees Celsius (54 degrees Fahrenheit). Surface temperature observations confirm this extreme contrast: In Calgary, Alberta the afternoon high temperature was 45°F, while in Nashville, Tennessee the high was a mere 17°F (location of both cities shown with circles). In contrast, just 5 days earlier, on January 11th, the afternoon high temperatures in Calgary and Nashville were -15°F and 69°F, respectively. This pattern reversal is indicated in the image from January 11, which clearly shows the warmth focused in the eastern US, and sharply colder arctic air moving south into west central Canada. Mapping the global patterns of temperature from NOAA-20 will help in a range of efforts, from identifying regional climate changes, to locating areas of extreme cold in the upper atmosphere which can pose hazards to commercial aviation. Global observations from ATMS and other microwave sounders provide the critical data source needed by weather forecast models to predict these weather patterns out to 7 days.
Image processing by NOAA/Center for Satellite Applications and Research.
Contributors: NOAA/NESDIS/STAR MiRS Algorithm Development Team and JPSS Program Science
Learn more about the NOAA-20 satellite and the capabilities of its instruments here