NOAA-21 First Light Images
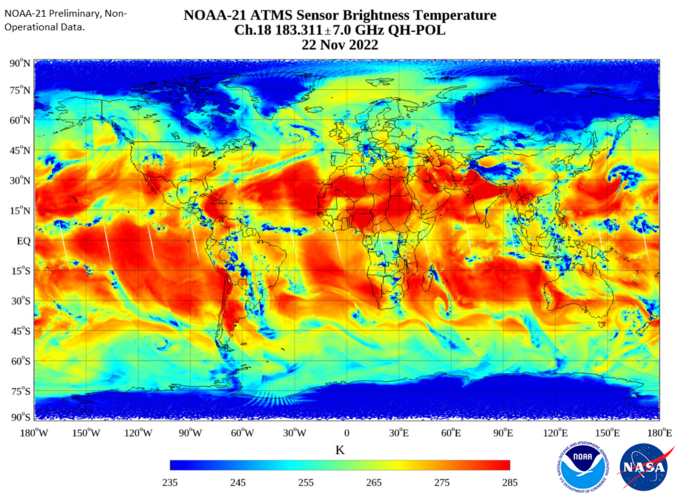
STAR JPSS has produced first light imagery from the recently launched NOAA-21 satellite. The image selected shows the Channel 18 (183 Ghz) Brightness Temperature for the ascending node on November 21-22. ATMS is the first NOAA-21 instrument to be activated.
Thanks and credit: STAR ATMS SDR Team. Click images to enlarge.
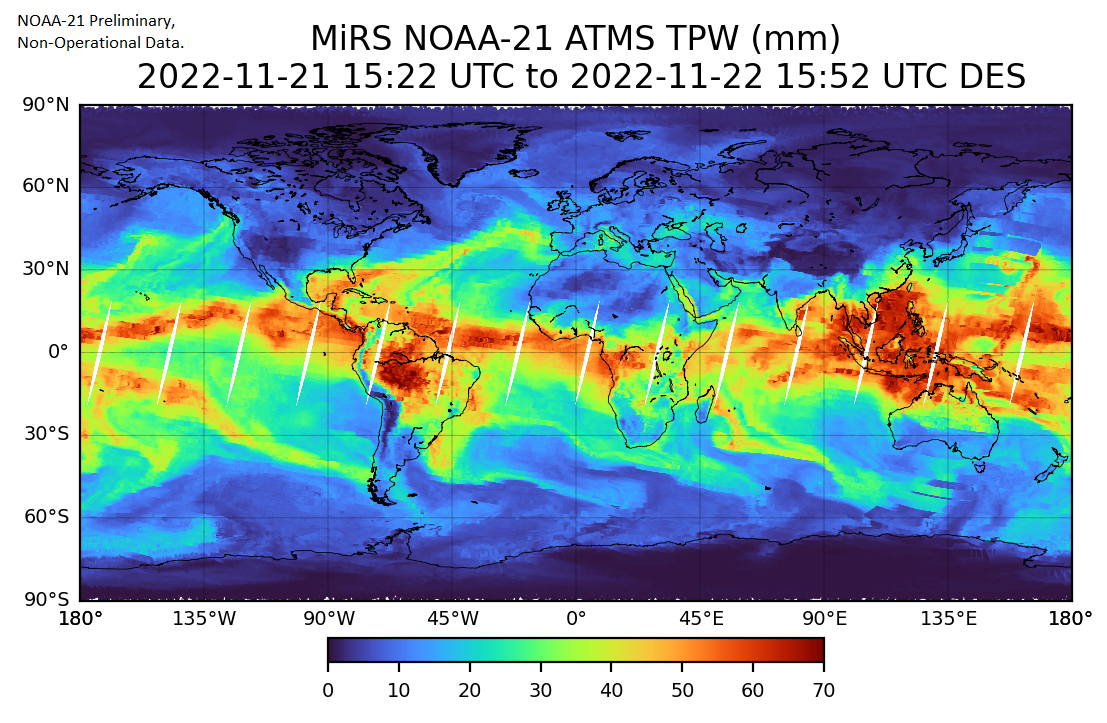
STAR JPSS has produced first light imagery from the recently launched NOAA-21 satellite. The image selected shows the ATMS-derived MIRS Total Precipitable Water for the ascending node on November 21-22. ATMS is the first NOAA-21 instrument to be activated.
Thanks and credit: STAR MiRS EDR Team. Click images to enlarge.
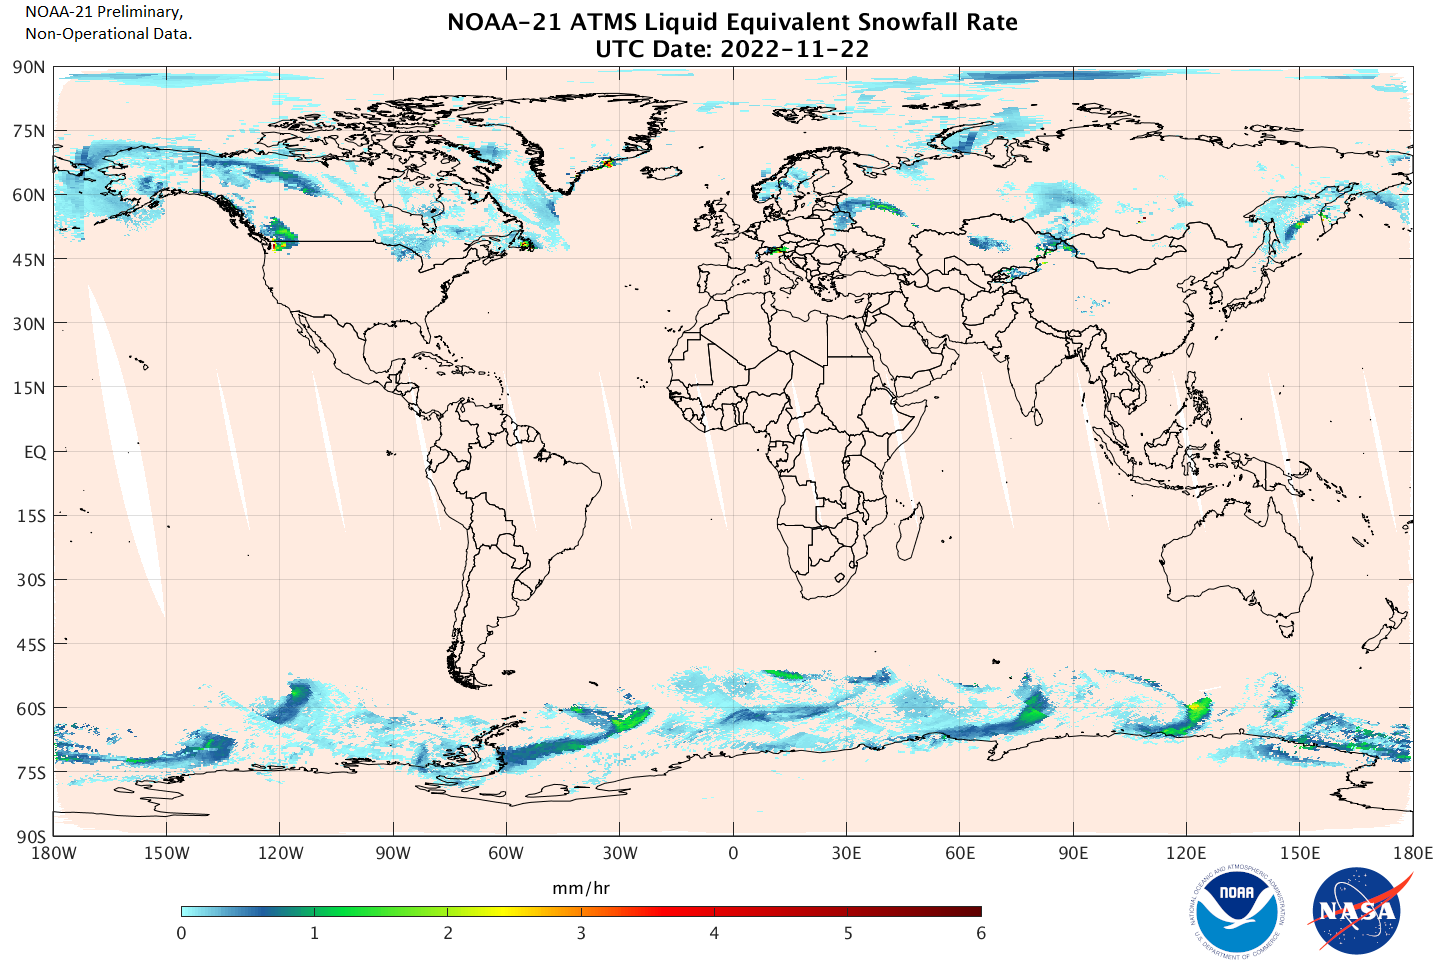
STAR JPSS has produced first light imagery from the recently launched NOAA-21 satellite. The image selected shows the ATMS-derived Snowfall Rate product for the ascending node on November 21-22. ATMS, which is the first NOAA-21 instrument to be activated will be followed by CrIS, VIIRS, and OMPS in the coming month.
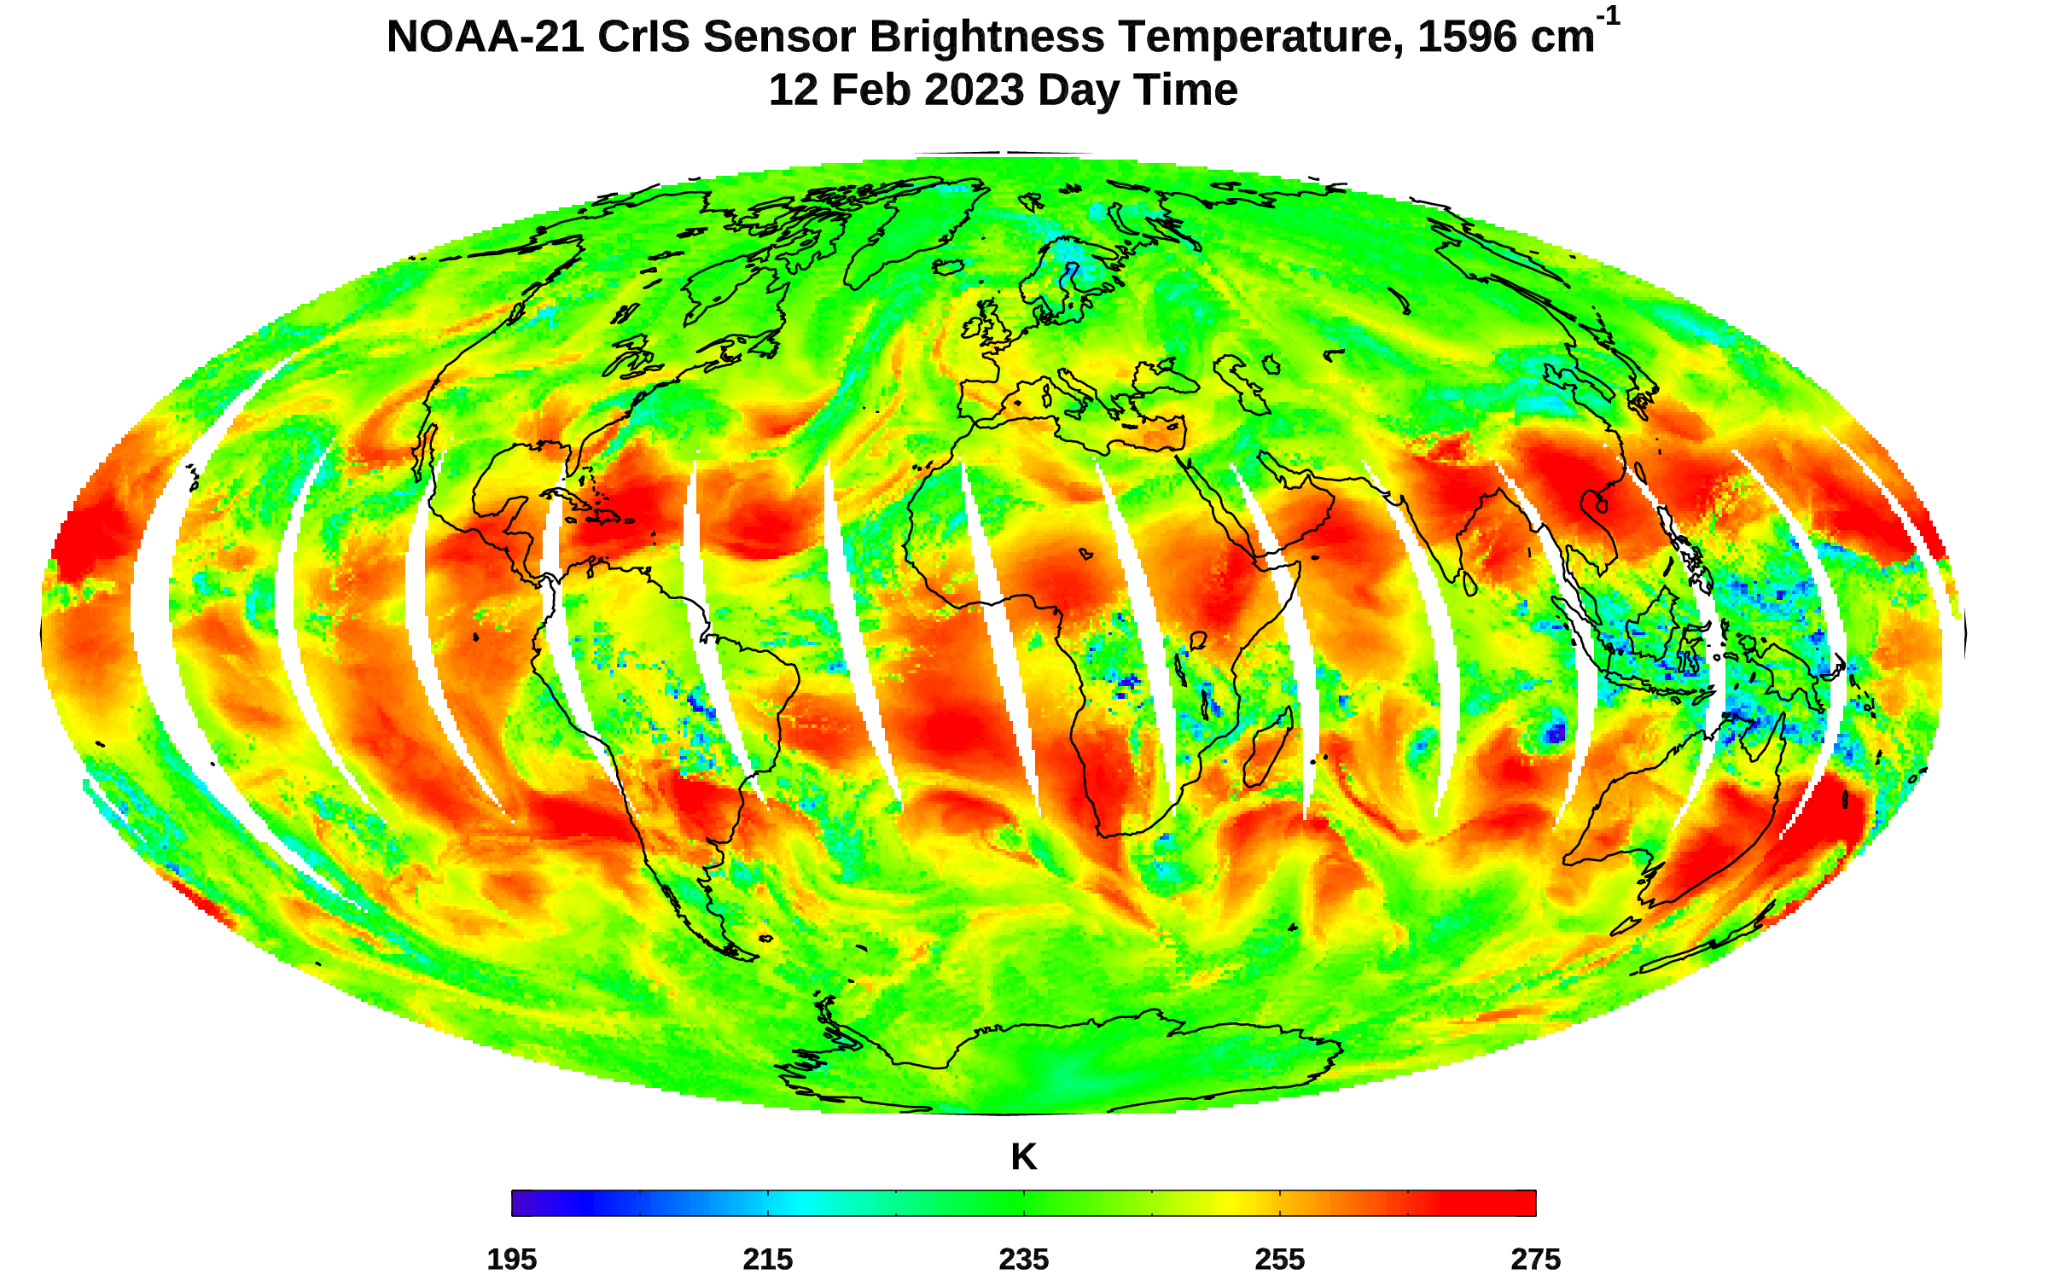
NOAA-21 CrIS First Light Image - The CrIS sensor provides hyperspectral infrared observations over 2,211 channels with high radiometric and spectral accuracy. The first light image in brightness temperature was captured by the NOAA-21 CrIS sensor at the 1596 cm-1 water vapor channel on February 12, 2023. This image shows the large-scale waves of upper tropospheric water vapor and clouds over the Earth’s globe.
Thanks and credit: STAR CrIS SDR Team. Click images to enlarge.
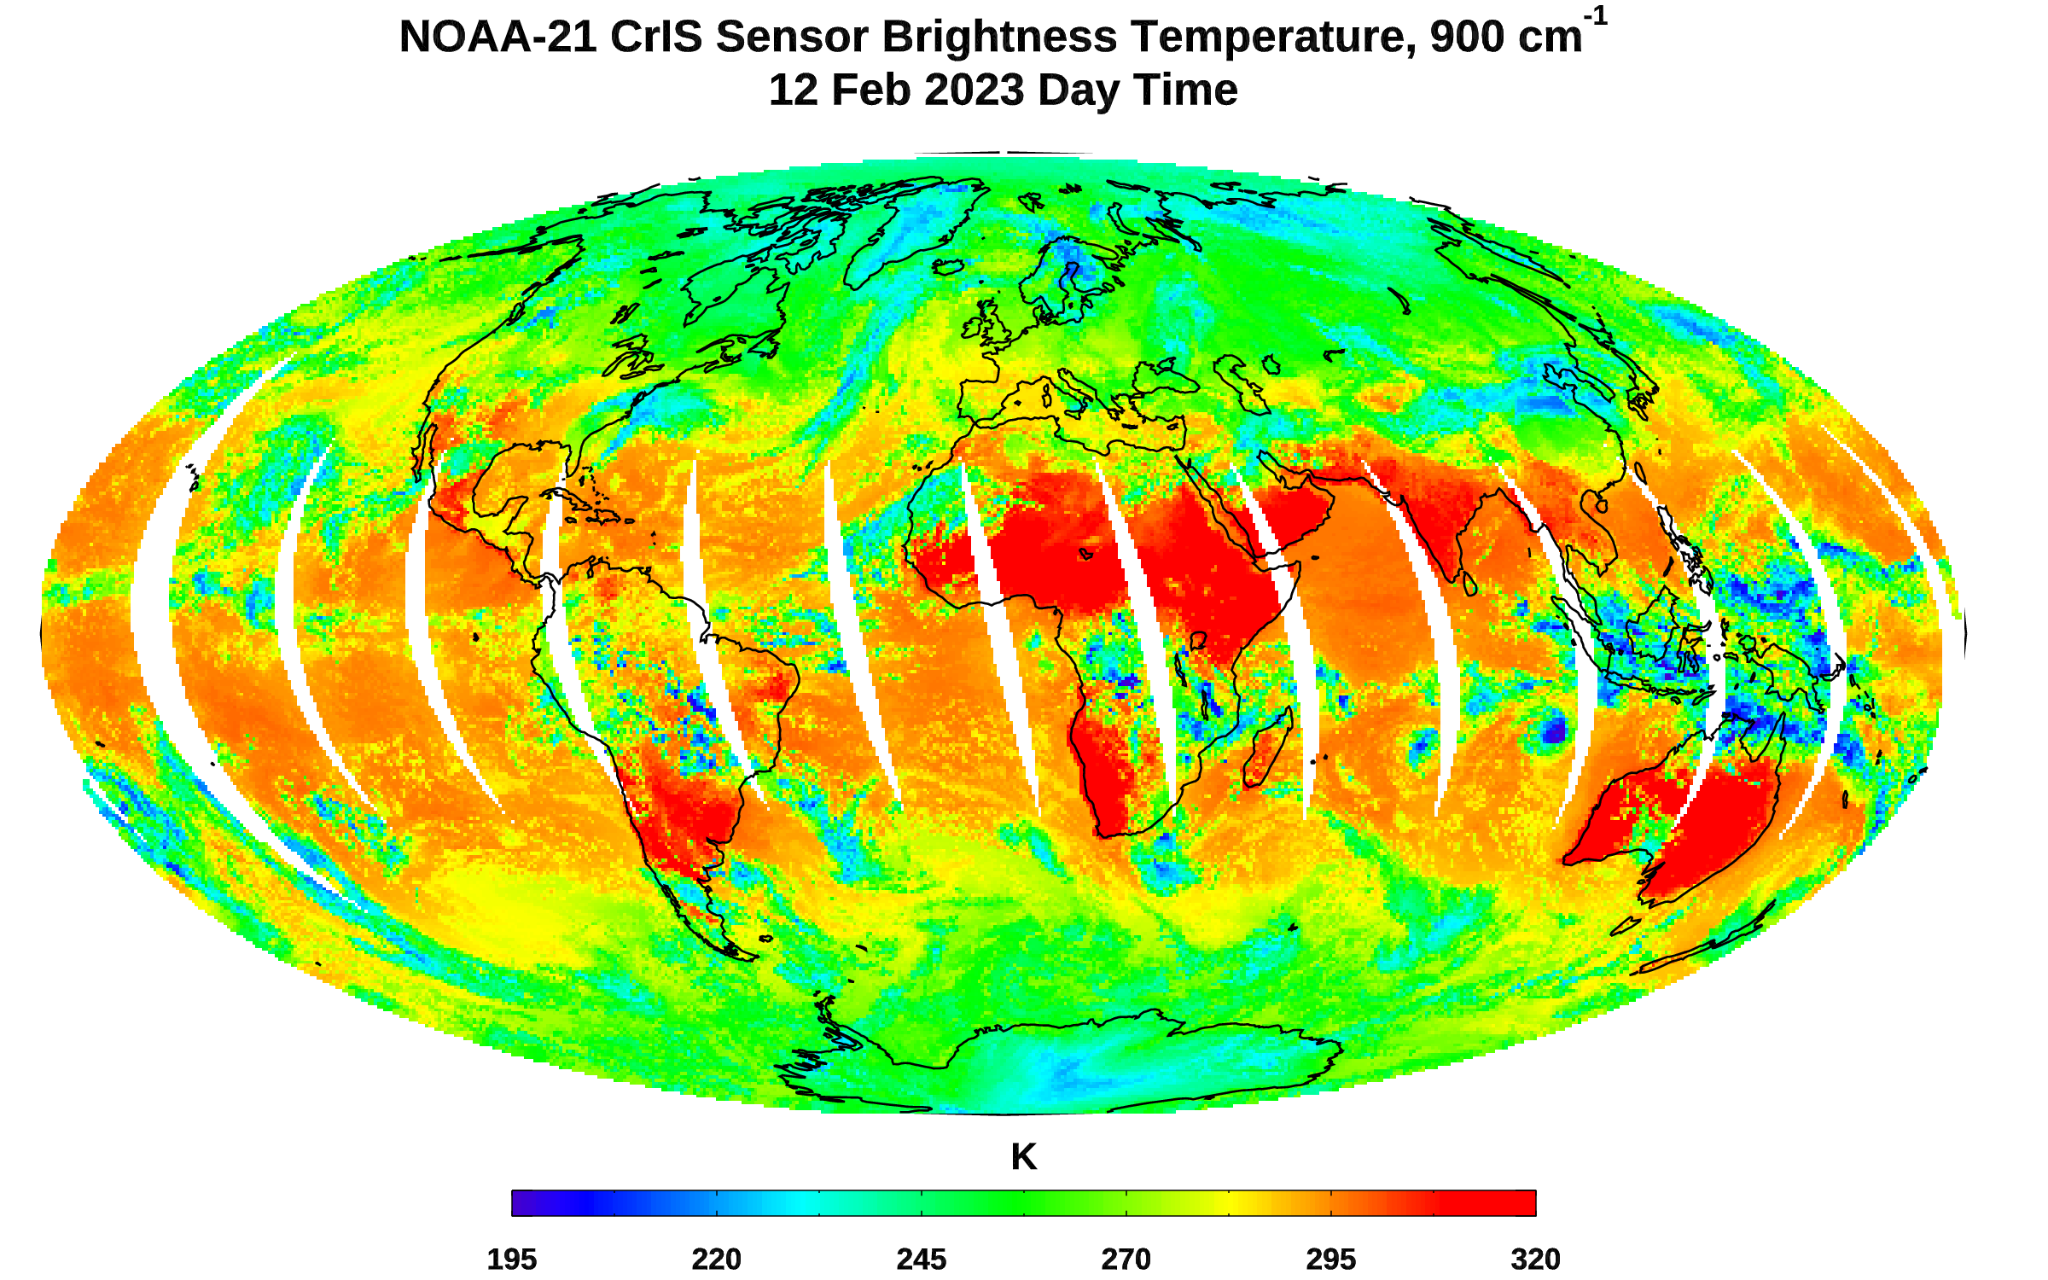
The CrIS sensor provides hyperspectral infrared observations over 2,211 channels with high radiometric and spectral accuracy. The first light image in brightness temperature captured by the NOAA-21 CrIS sensor at the 900 cm-1 window channel on February 12, 2023 is shown. Dark blue colors in the image are associated with cold cloud tops or cold surfaces. Red color regions are associated with light clouds or hot land surfaces.
Thanks and credit: STAR CrIS SDR Team. Click images to enlarge.
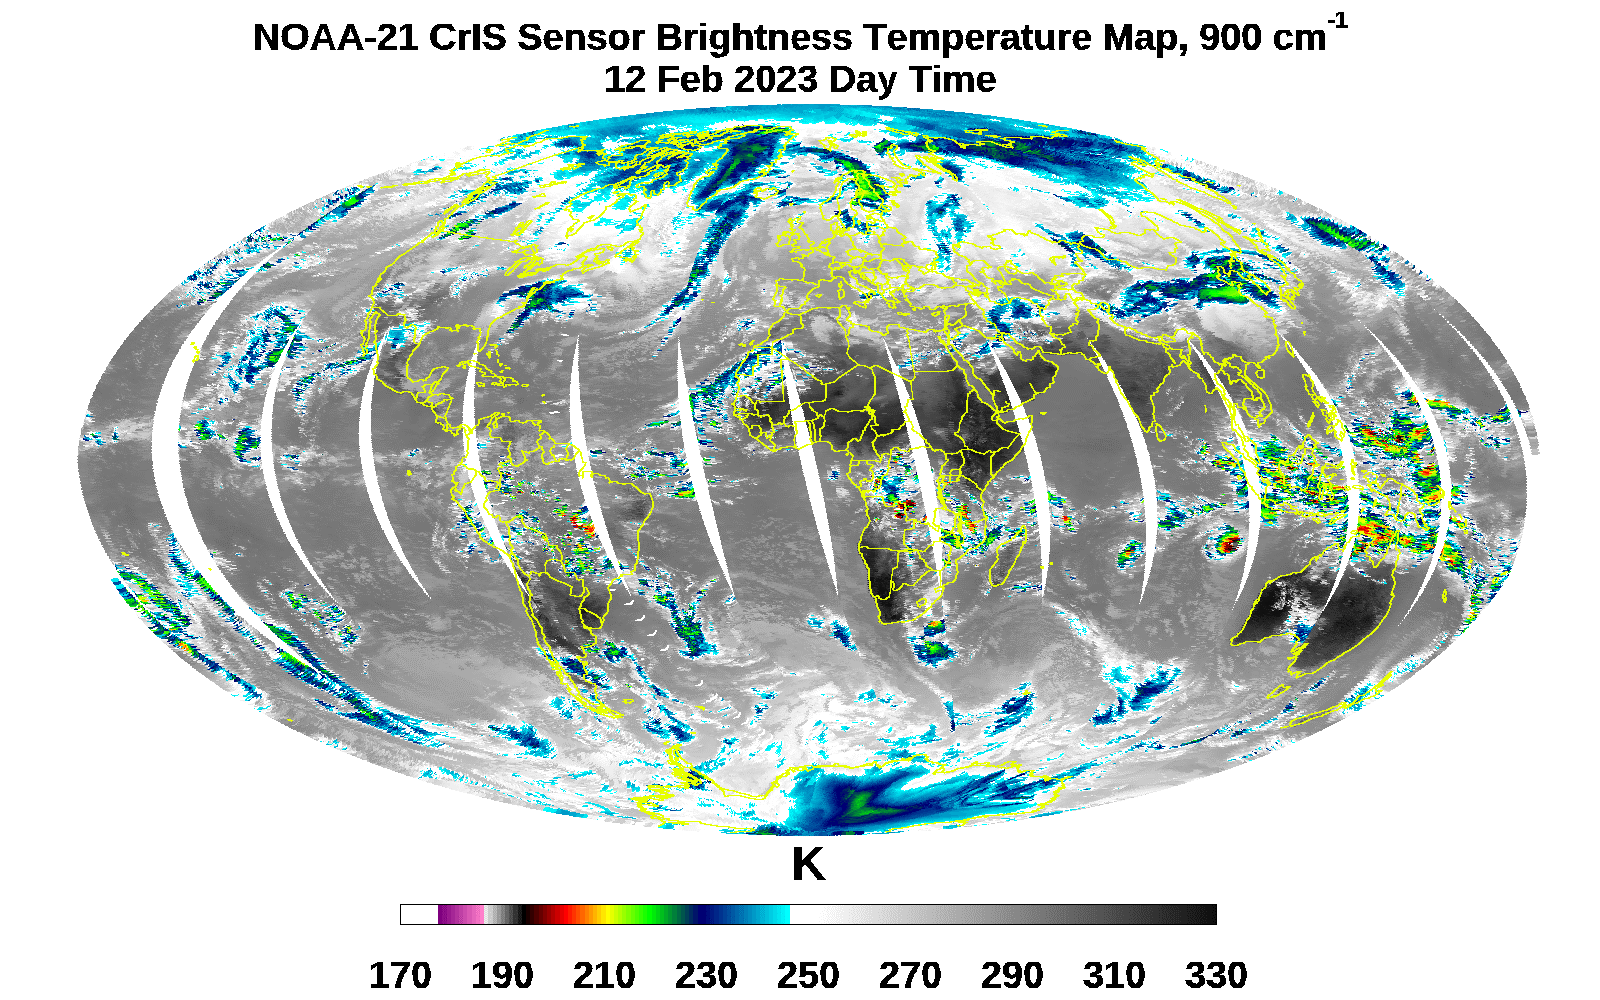
The CrIS sensor provides hyperspectral infrared observations over 2,211 channels with high radiometric and spectral accuracy. The first light image in brightness temperature was captured by the NOAA-21 CrIS sensor at the 900 cm-1 window channel on February 12, 2023. This image identifies different types of clouds at different vertical levels in the atmosphere.
Thanks and credit: STAR CRIS SDR Team. Click images to enlarge.

Thanks and credit: STAR VIIRS SDR Team. Click images to enlarge.
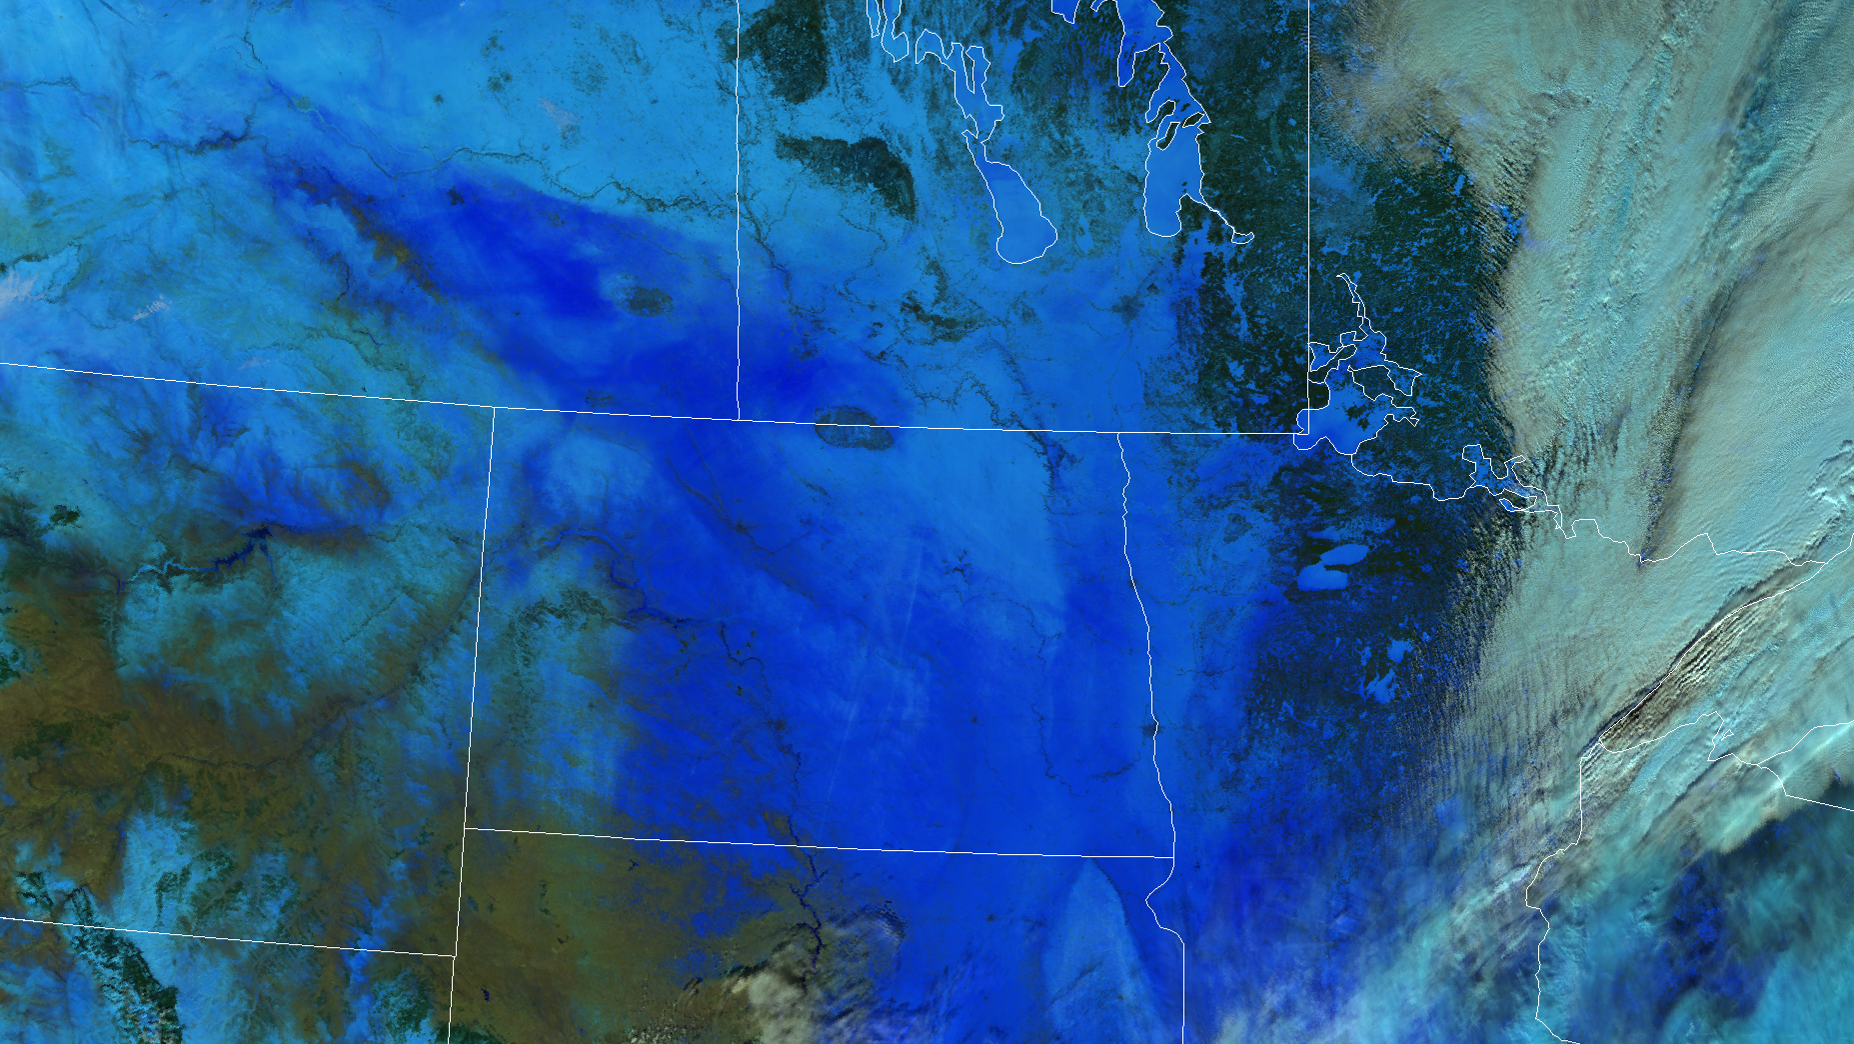
NOAA-21 VIIRS thermal emmissive bands became active on February 9. The image above shows Snow Melt RGB imagery made with VIIRS bands M1-, M8, and M5. In this image, light blue areas are newer and drier snow, while darker blue areas are wetter and older snow.
Thanks and credit: STAR VIIRS Imagery Team. Click images to enlarge.
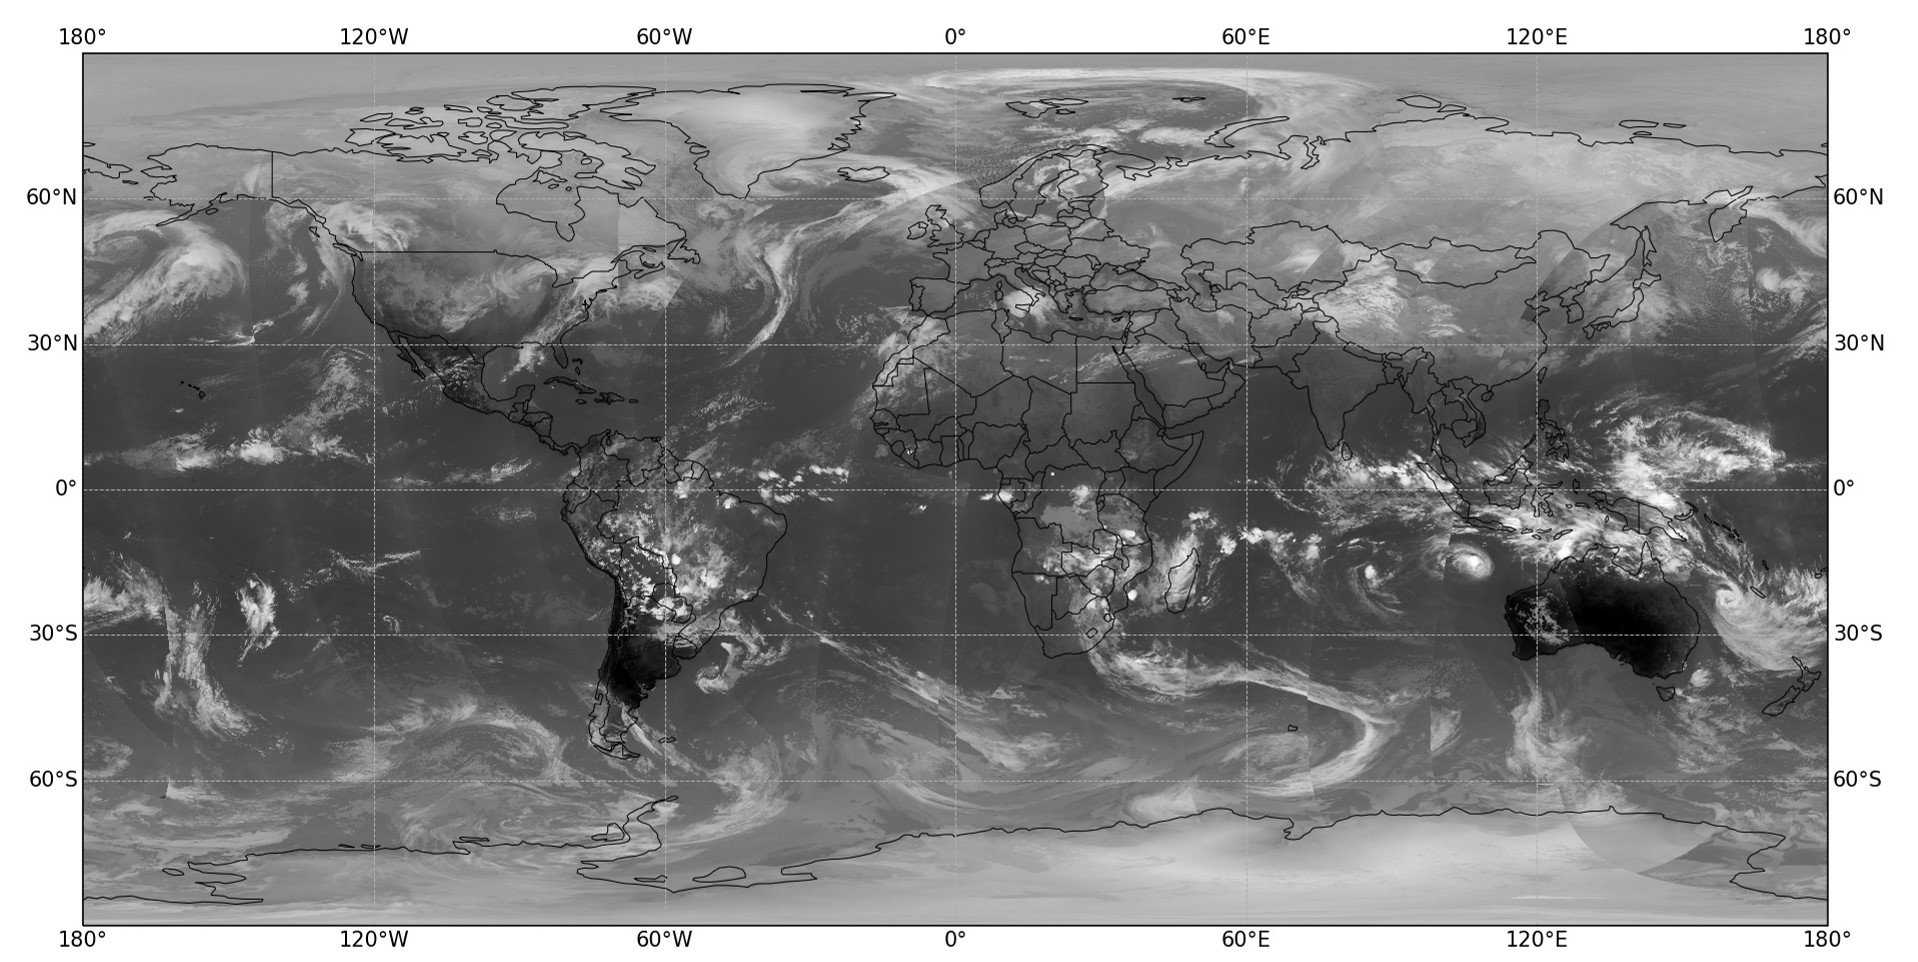
Grayscale imagery of VIIRS Band M15 from February 9. Band M15 is a thermal band is centered on 10.8 um and detects clouds and surface features including fire hotspots. Colder temperatues are lighter and warmer tmperatures closer to black. One can see the warmth of the land in the southern hemisphere where it is summer relative to the cold land and ice of the northern hemisphere winter.
Thanks and credit: STAR VIIRS SDR Team. Click images to enlarge.
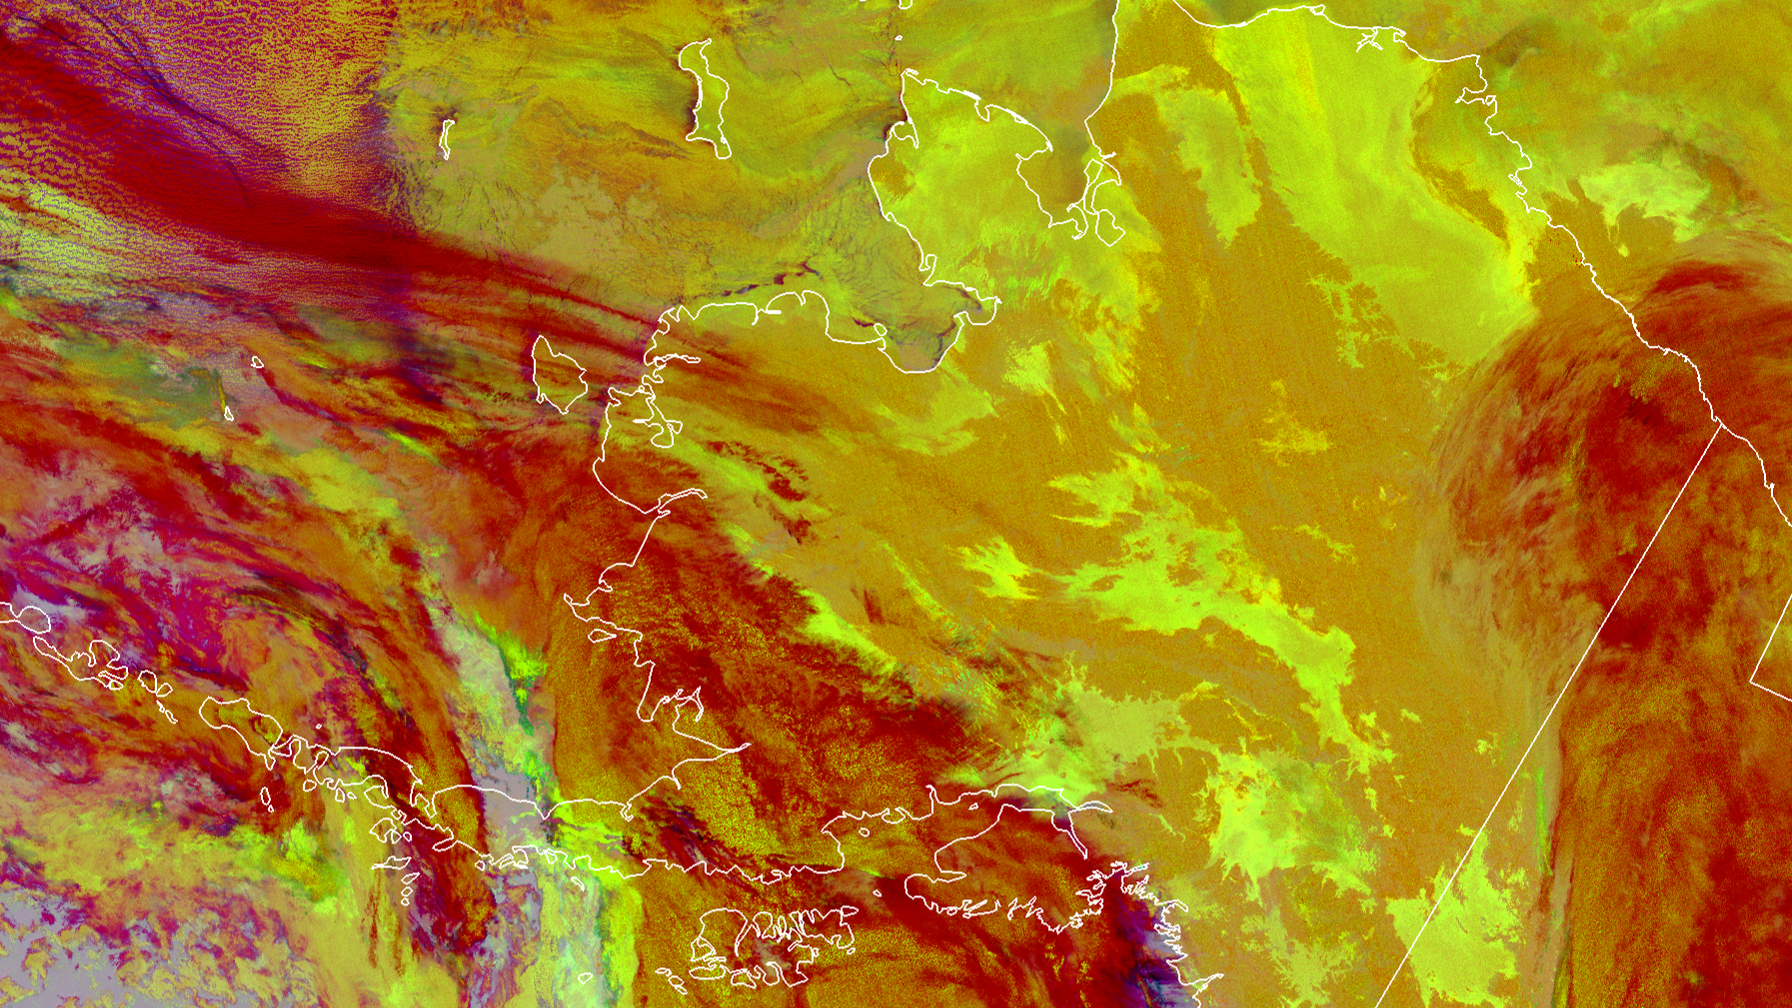
The NOAA-21 VIIRS Nighttime Cloud Microphysics RGB from February 9, 2023, shows various aspects of cloud structures. The maroon color represents high, thick cloud structures, while the darker yellow represents mid-level clouds.
Thanks and credit: STAR VIIRS Imagery Team. Click images to enlarge.
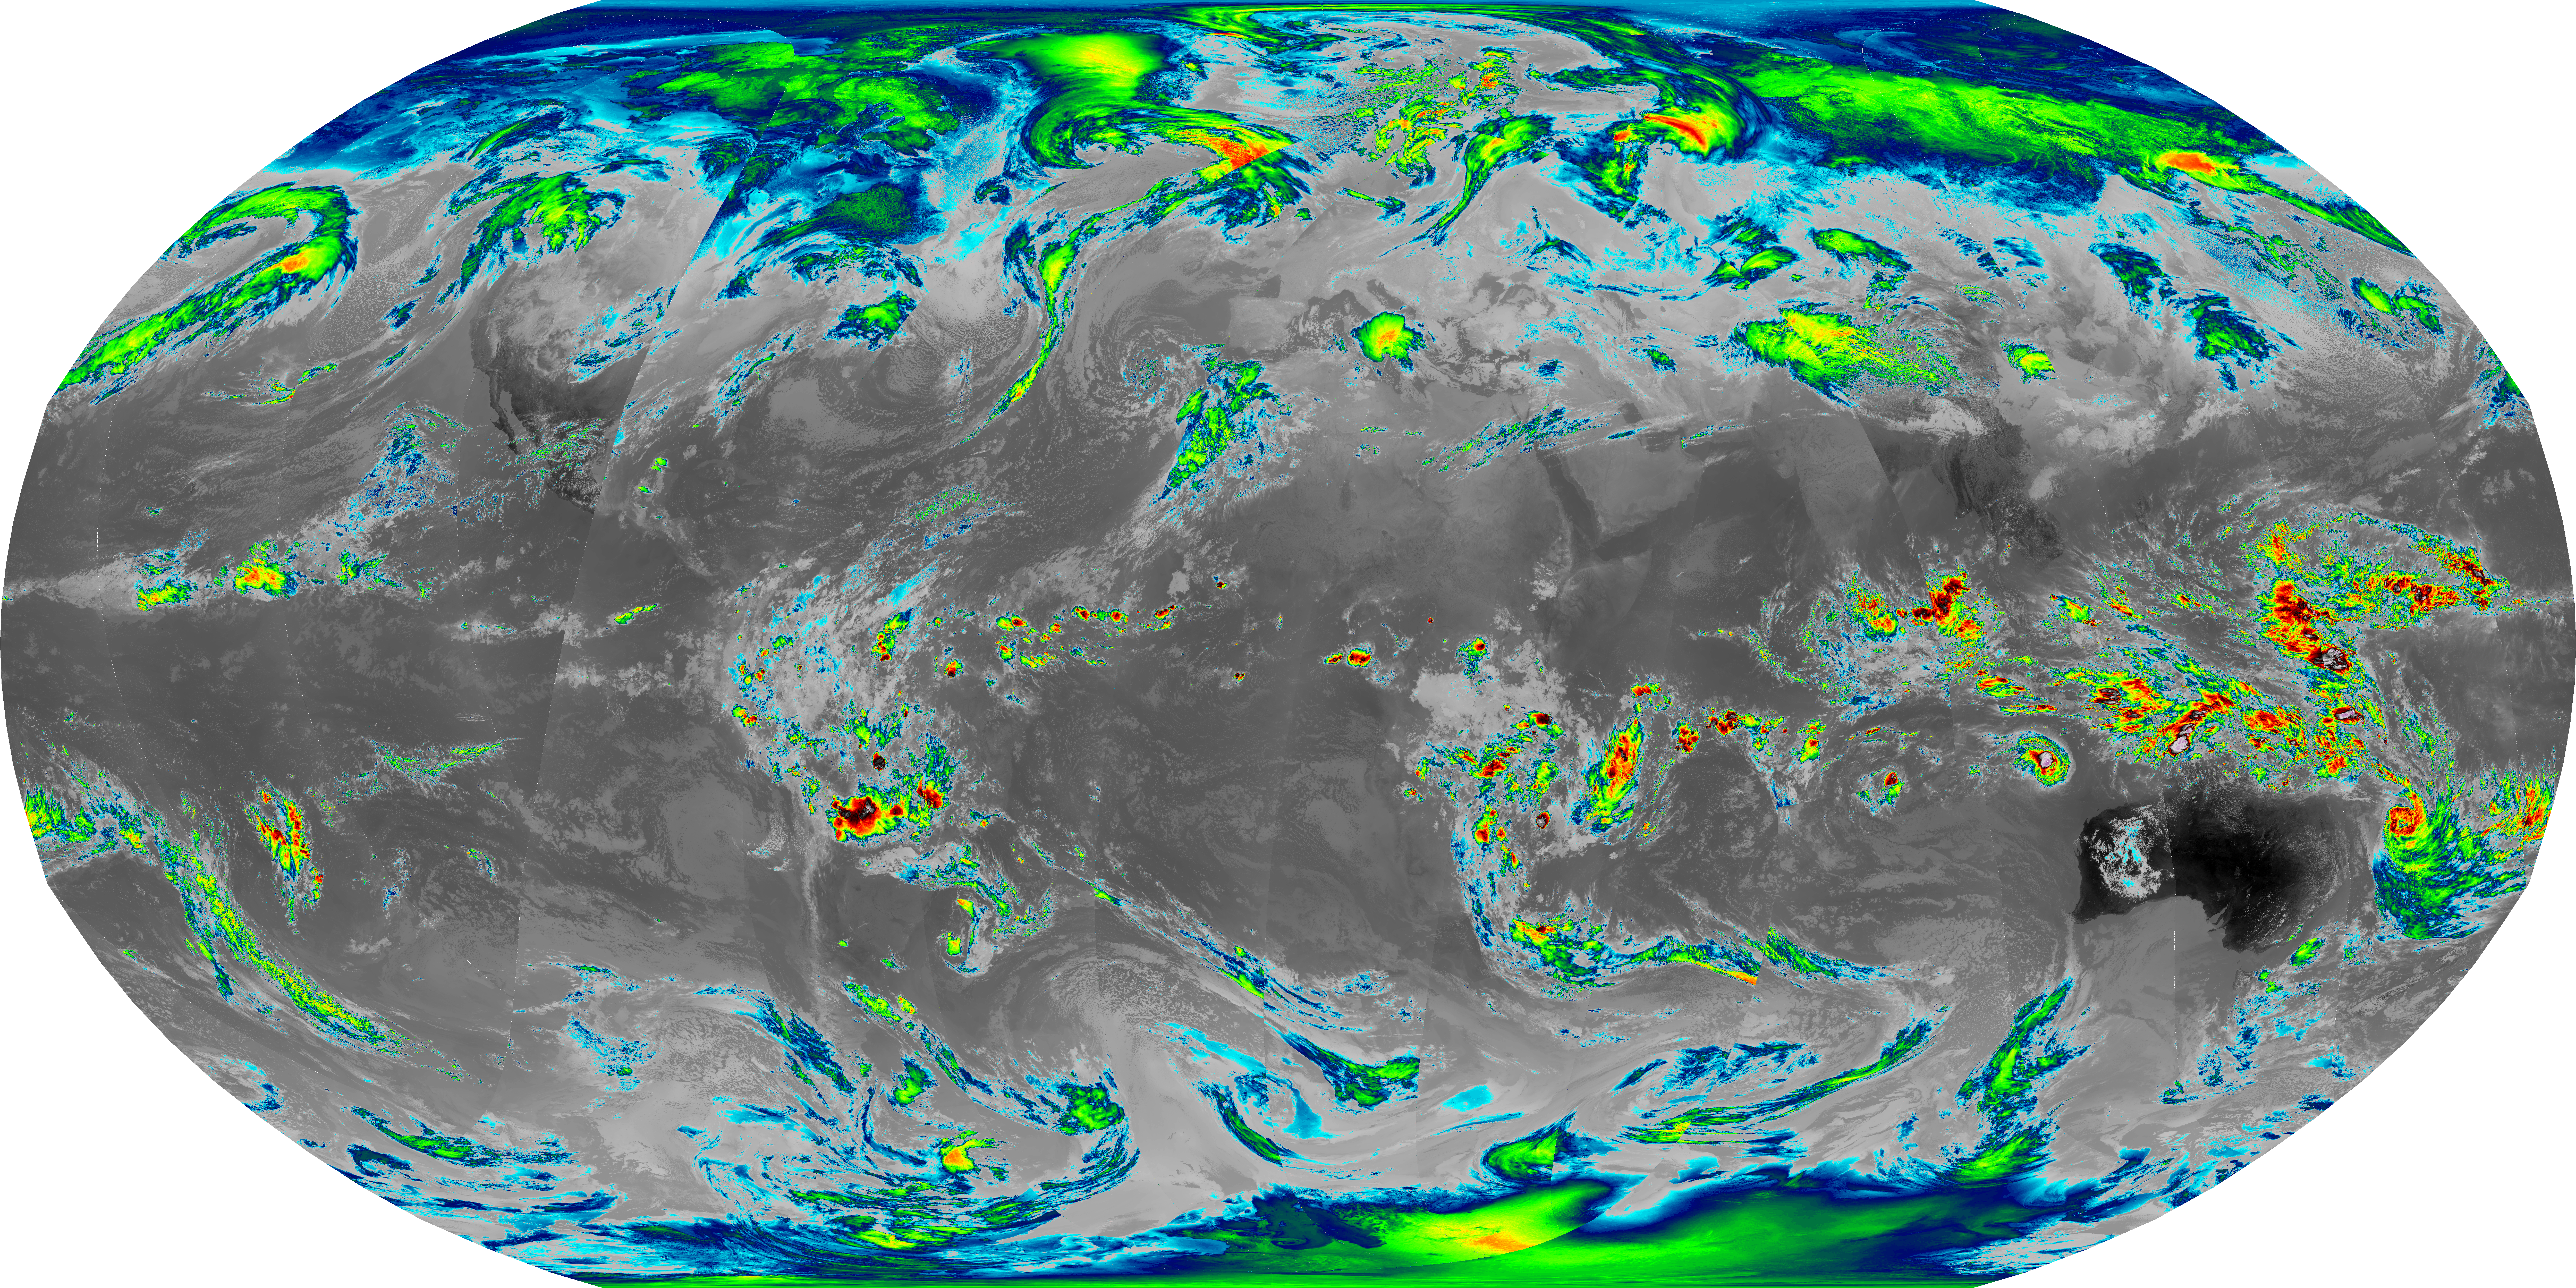
NOAA-21 VIIRS Band M15 (centered at 10.8 um) is seen in this global image. This traditional color scale is used to see storms systems including tropical cylcones. Cylcone Freddy, which eventually made landfall on Madagascar and Mozambique can be seen early in its formation off of the northwestern coast of Australia.
Thanks and credit: STAR VIIRS Imagery Team. Click images to enlarge.
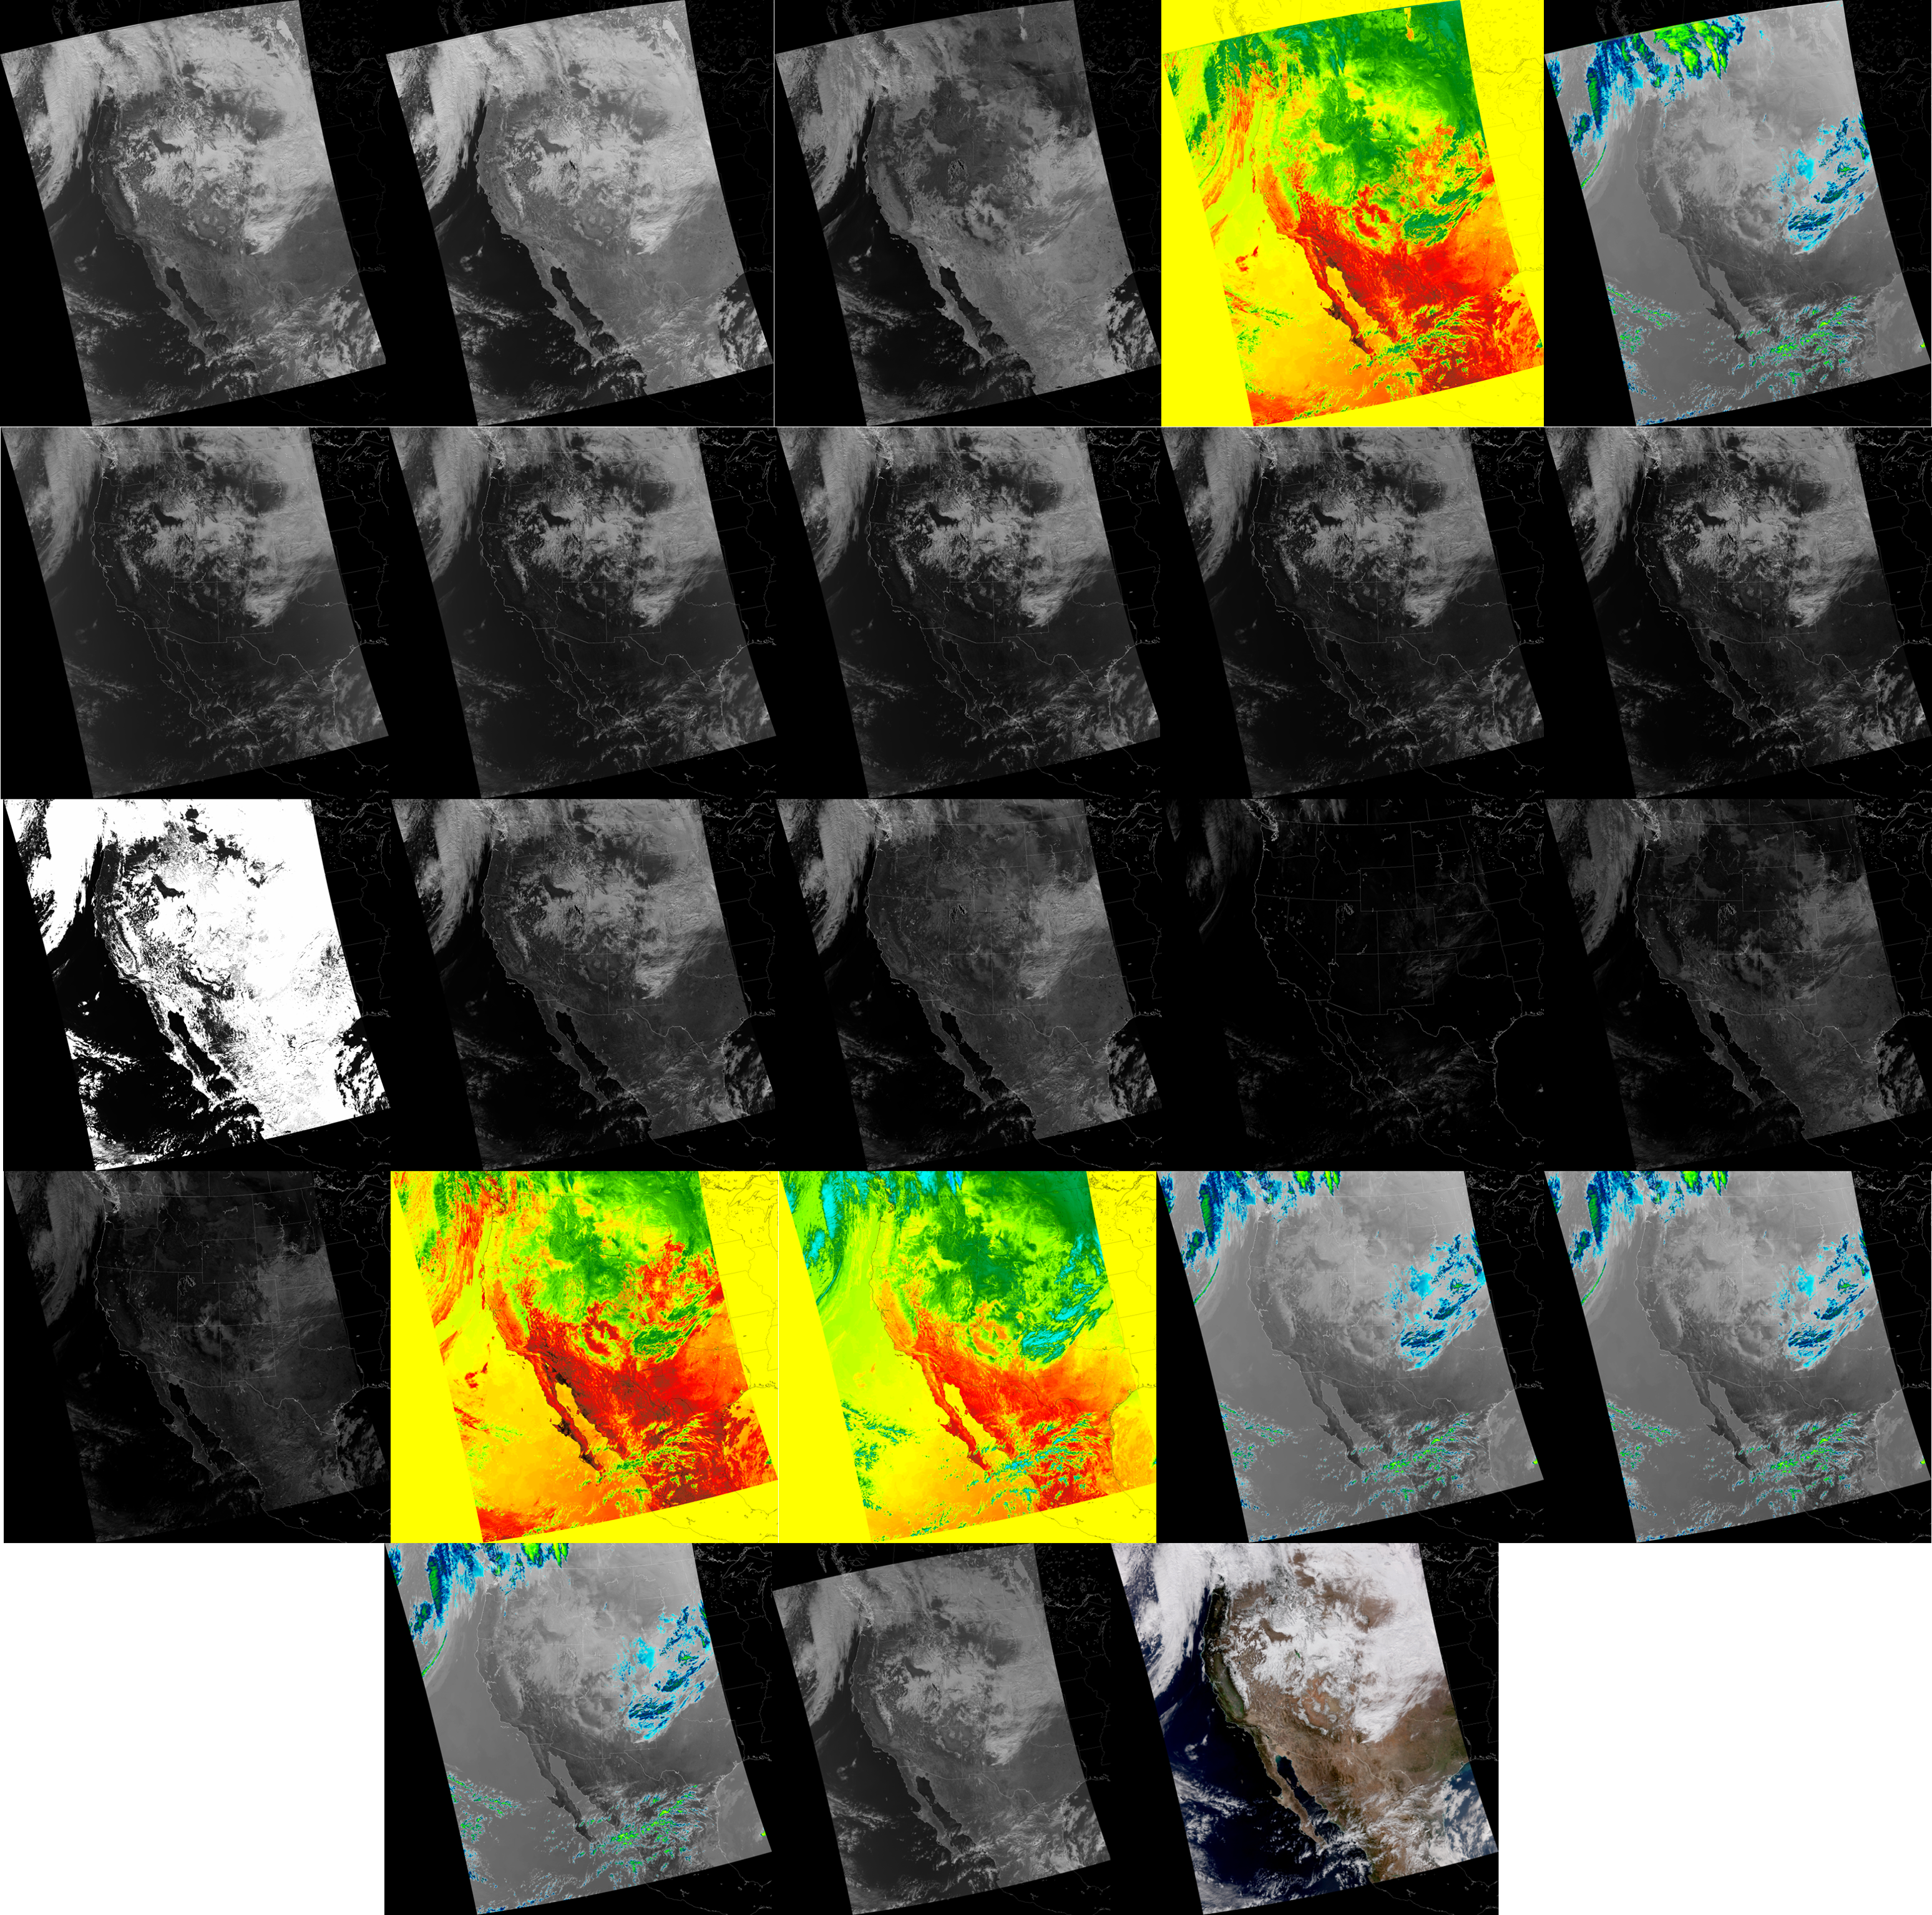
This mosaic of images shows views for all VIIRS bands, plus the true color composite over the western United States on February 9, 2023. VIIRS is capable of detecting visible and near infrared wavelengths. The patterns seen in each image differ due to the different absorption, reflection, and radiation values for different wavelgenths of light in the land, atmosphere, and ocean.
Thanks and credit: STAR VIIRS Imagery Team. Click images to enlarge.
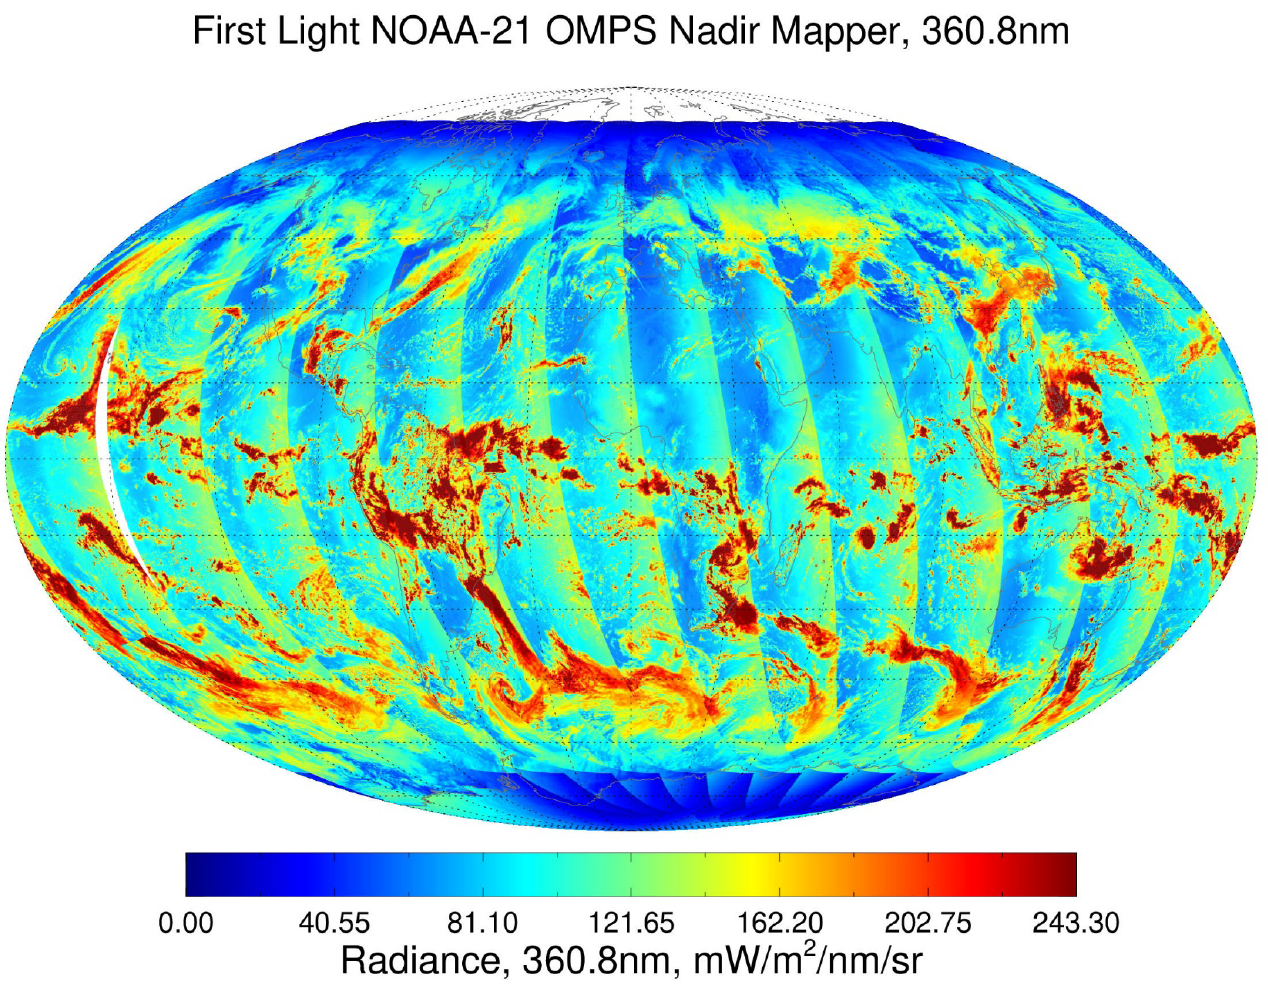
NOAA-21 OMPS NM First Light Image - The Ozone Mapping Profiler Suite (OMPS) instrument on the NOAA-21 satellite acquired its first data on February 18, 2023. This first-light image shows the radiance values for the cloud reflectivity channel on the OMPS Nadir Mapper. The highest radiances are associated with bright cloud tops. The cloud reflectivity channel is one of the five primary channels used to estimate total ozone concentration. The striping pattern is created from the slight differences in the angle of the satellite relative to the incoming energy from the sun.
Thanks and credit: STAR OMPS SDR Team. Click images to enlarge.
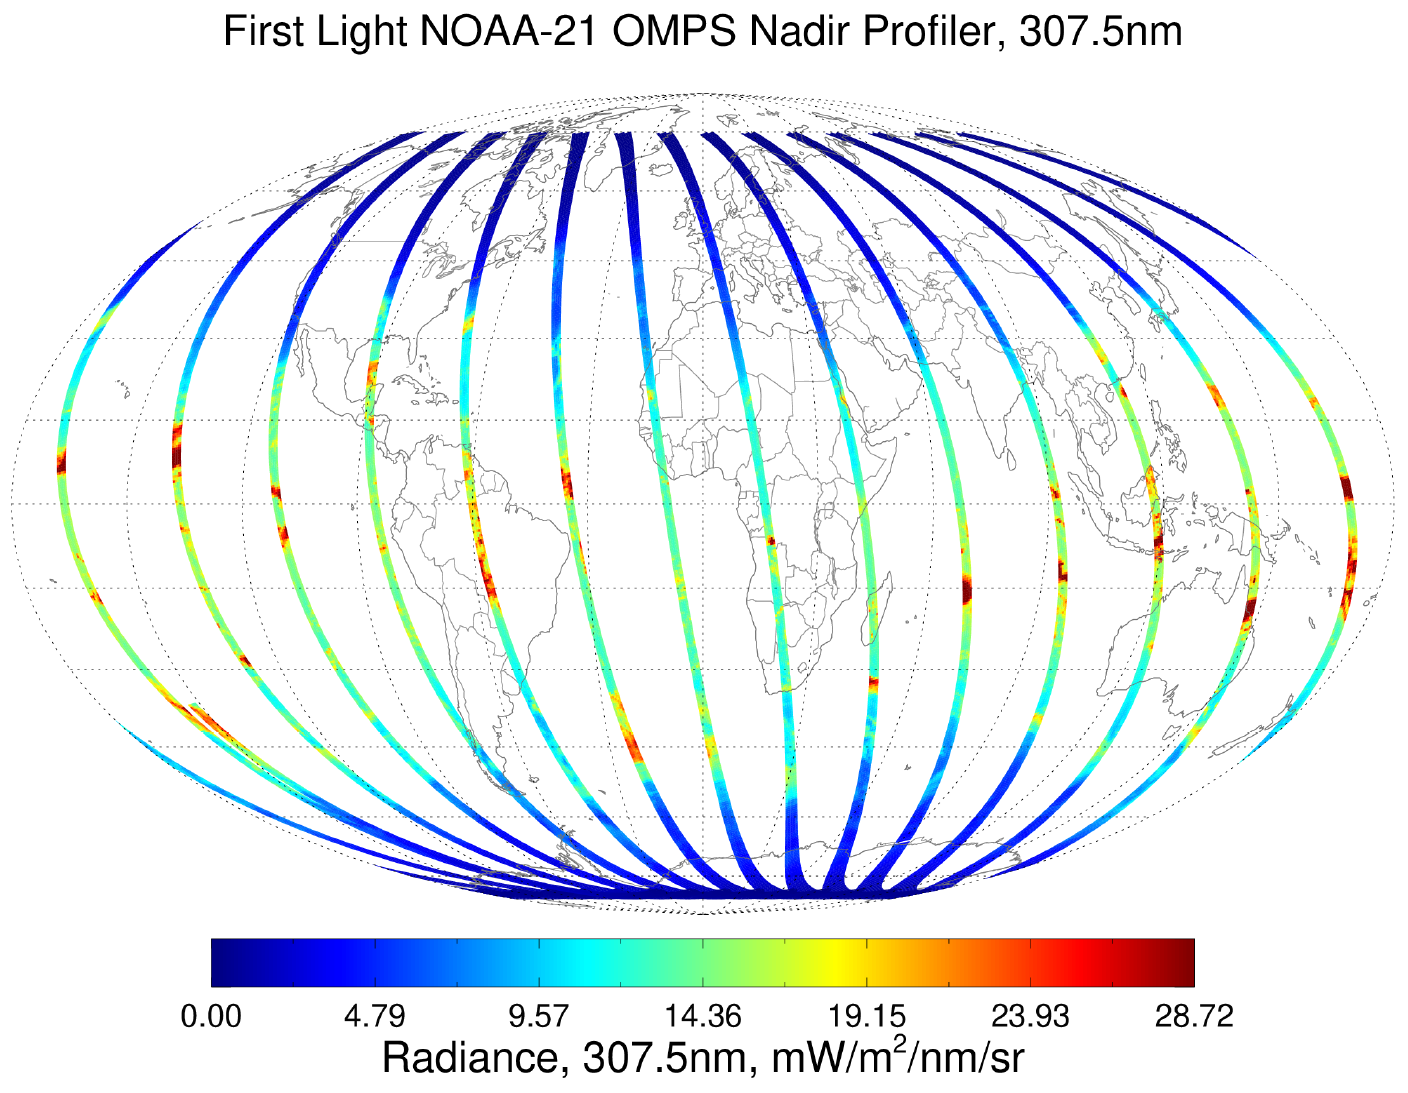
NOAA-21 OMPS NP First Light Image - The Ozone Mapping Profiler Suite (OMPS) instrument on the NOAA-21 satellite acquired its first data on February 18, 2023 This first-light image shows the radiance at 307.5 nm from the OMPS Nadir Profiler. This measurement is one of the 12 primary channels used to estimate the ozone at various levels in the atmosphere - closer to and farther from Earth's surface. The OMPS Nadir Profiler only makes measurements directly under the satellite's path.
Thanks and credit: STAR OMPS SDR Team. Click images to enlarge.

